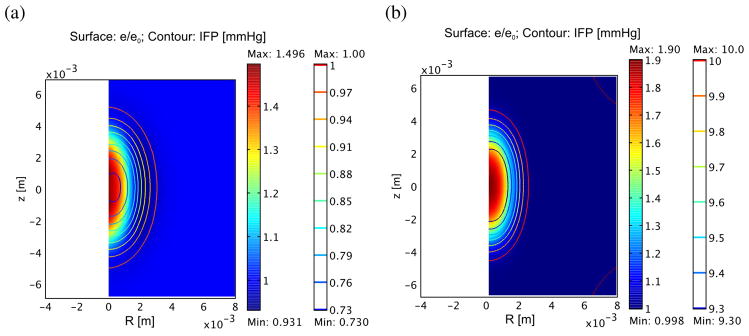
Figure 2.

Relative dilatation (surface plot) and interstitial pressure (contours) for normal (a) and tumor (b) following 60 s treatment as described in figure 1. For simplicity, steady state IFP is assumed to be 1 mmHg for normal tissue and 10 mmHg for tumor.
