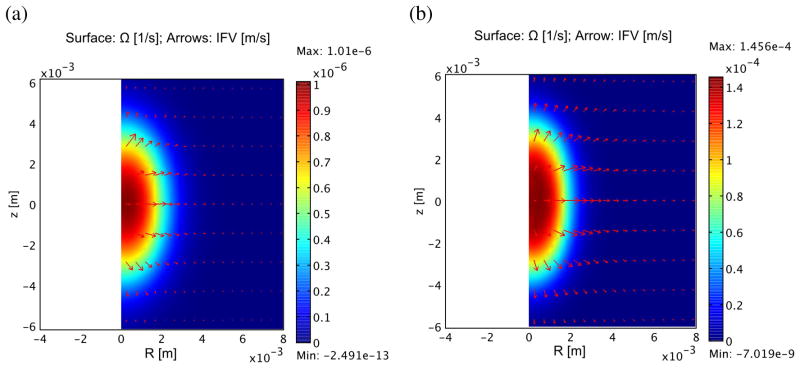
Figure 4.
Influx of fluid into treated zone from vasculature (surface) and convection from surrounding tissue (arrows) in normal muscle (a) and tumor tissue (b). The largest arrow in the normal tissue represents a flow of 2.5 × 10⁻⁹m/s, while in the tumor it is 6.0 × 10⁻⁸m/s. Note that in spite of the inward fluid flow relative to the tissue (−K∇Pi · r < 0), the net IFV still outward because the tissue itself is expanding at a greater rate ( ). Fluid influx from the vasculature is the major component of this process and is significantly more rapid in the tumor due to high vascular permeability.

