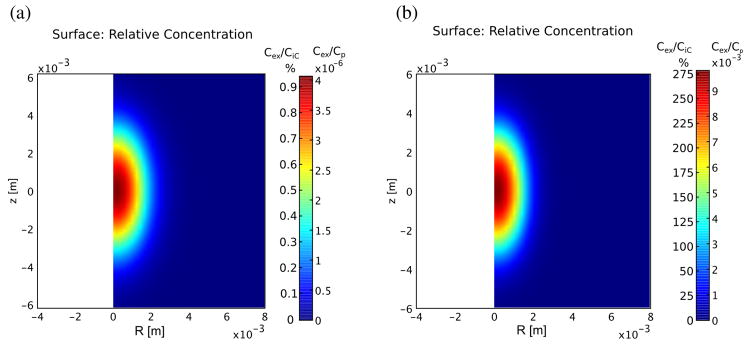
Figure 5.

Excess concentration of IgG in at the end of treatment for normal (A) and tumor (B) tissue assuming the plasma concentration is 1 mol/m3. Influx into the tumor is three orders of magnitude greater due to the much greater permeability of the vascular source. The concentration due to steady state diffusion at 60 s is 4.45 × 10⁻⁴Cp for normal muscle and 3.5 × 10⁻³Cp for tumor tissue, so the peak values in (a) and (b) above represent almost 1% and over 275% of the background concentrations.
