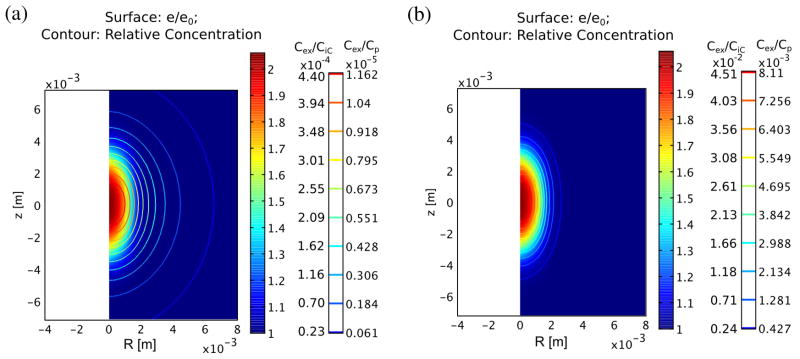
Figure 6.

Distribution of excess concentration after 1 hour in normal (a) and tumor tissue (b). Contours indicate excess concentration while relative dilatation is shown as the surface color at the same time point. These numbers represent maximum increases of almost 0.05% and 4.5% over the background values of 0.0264 Cp and 0.18 Cp, respectively, in normal and tumor tissues.
