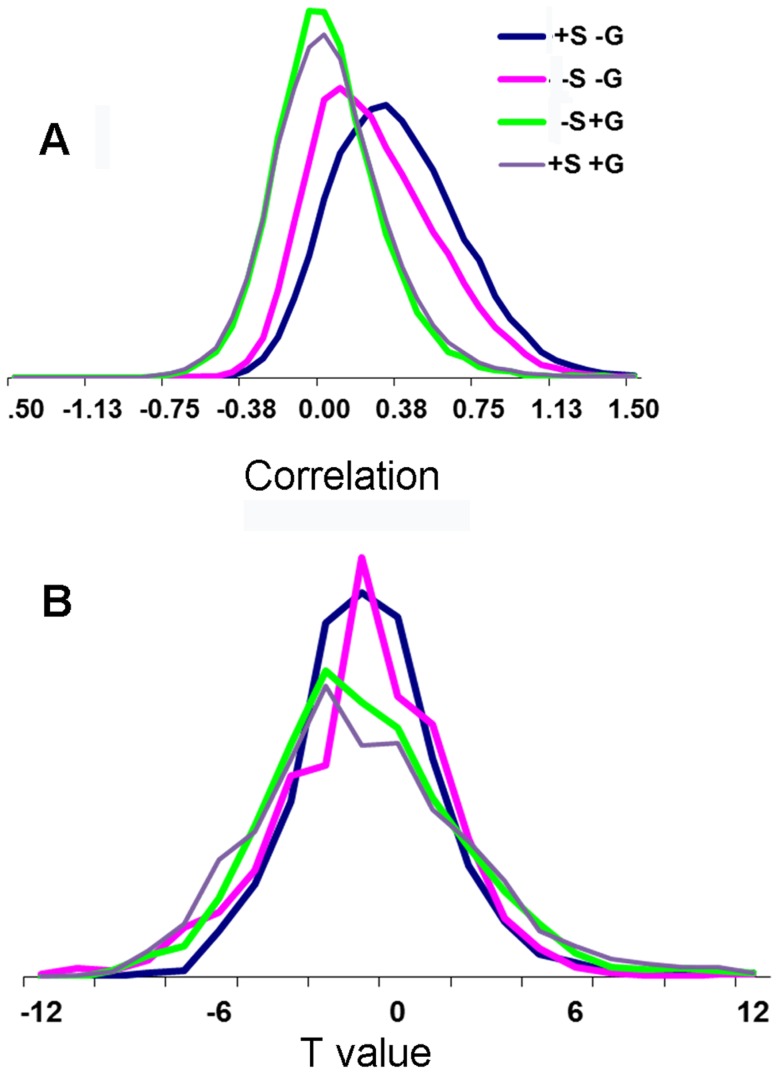
Figure 1. Distributions of Fisher transformed and of t-values for the four different analyses of the human data.
(A) Distributions of Fisher transformed values. (B) Distributions of t-values. The analyses differed in either applying or not applying spatial smoothing and correction for global signal. ‘–S -G’ – analysis without smoothing and without global regression, ‘+S -G’ – analysis with smoothing and without global regression, ‘–S +G’ – analysis without smoothing and with global regression and ‘–S -G’ – analysis with smoothing and with global regression.

