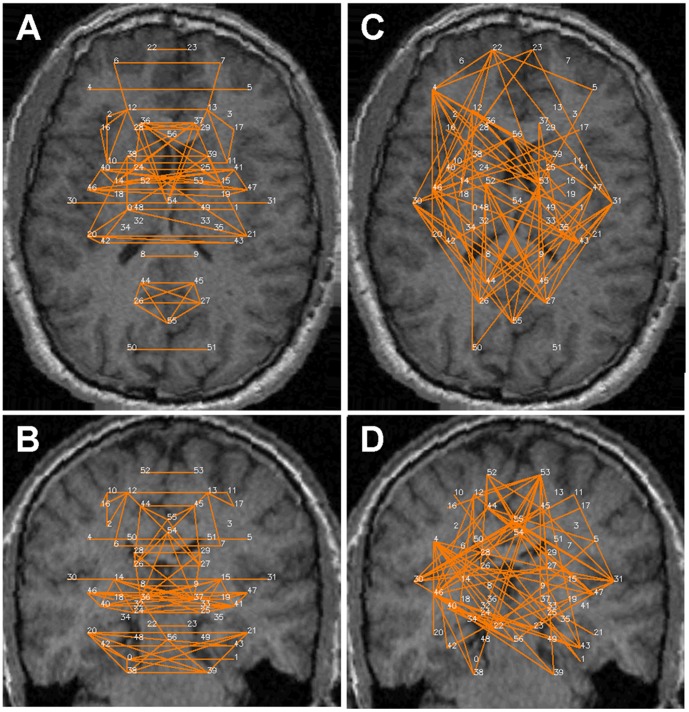
Figure 5. Significant connections within the 57 predefined human regions for the -S+G analysis.
Significant connections are presented as 2D projections on top of T1-weighted coronal and axial MRI images. ROIs are annotated using numbers provided in Table 1. A & B. Positive connections. C & D. Negative connections.

