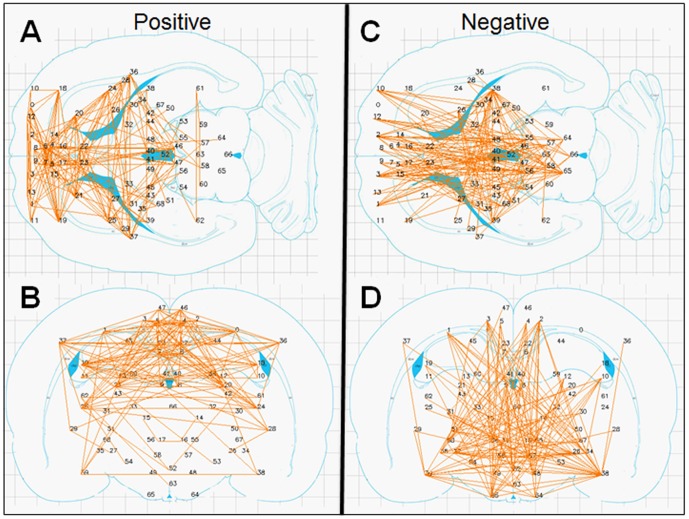
Figure 8. Significant connections within the 69 predefined rat regions.
Significant connections are presented as 2D projections on top of coronal and axial Figures from the rat brain atlas. ROIs are annotated using numbers provided in Table 2. A & B. Positive connections. C & D. Negative connections.

