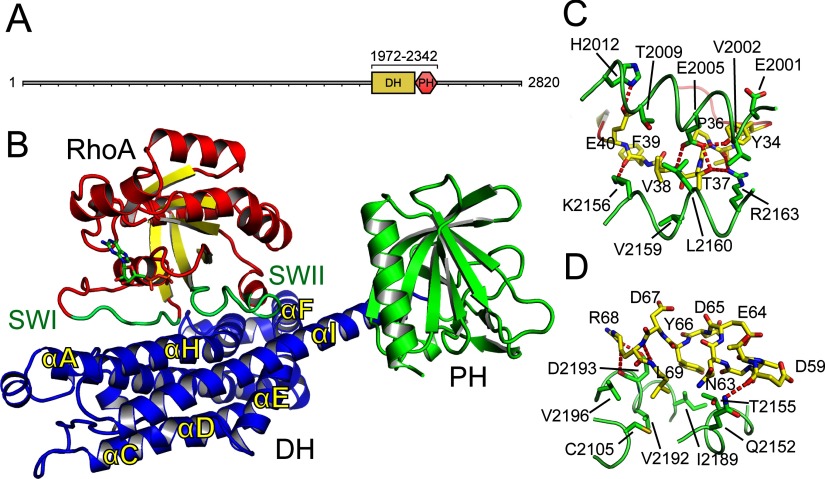
Figure 1. Structure of AKAP-Lbc.
(A) Protein domains of AKAP-Lbc (AKAP13). The range of the construct used for structure determination is shown above the DH and PH domains. (B) Overview of the complex between RhoA–GDP and the DH–PH domains of AKAP-Lbc. RhoA is shown with red α-helices and yellow β-strands, and with the switch I and switch II loops in green. AKAP-Lbc is shown with its DH domain in blue and PH domain in green. (C) The binding of the RhoA switch I loop. The switch I loop is shown in yellow, with the AKAP-Lbc DH domain shown in green. (D) The binding of the RhoA switch II loop, coloured as for (C).

