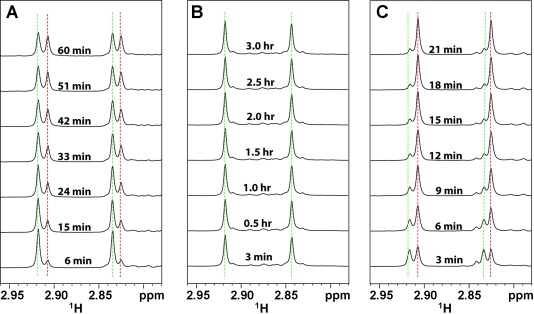
Figure 1.

1H NMR spectra of meropenem hydrolysis in the presence of 5 nM purified NDM-1 enzyme (A), E. coli cells (OD600=10.0) without NDM-1 plasmid (B), and E. coli cells (OD600=2.5) expressing NDM-1 (C). All samples were prepared in 50 mM sodium phosphate at pH 7.0 with 10 % deuterated water. The hydrolysis of meropenem (100 μM) at different time points was monitored by focusing on the 1H NMR signals from the nitrogen-attached methyl groups (Scheme 1). The green and red dotted lines denote the signals of substrate and product, respectively.
