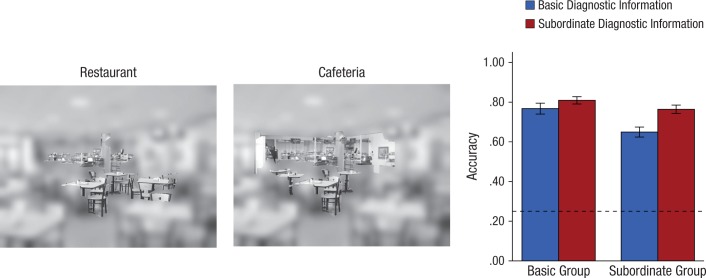
Fig. 6.
Paradigm and results from the validation experiment. Participants were asked to categorize individual scenes, but unlike in the gaze-contingent experiment, each scene contained objects identified as diagnostic at either the basic level (example shown on left) or subordinate level (example shown in middle). These objects were revealed at full resolution while the rest of the scene was low-pass filtered. The graph shows mean accuracy as a function of condition and the type of diagnostic information presented. The dashed line indicates chance performance. Error bars represent ±1 SE.

