Figure 5.

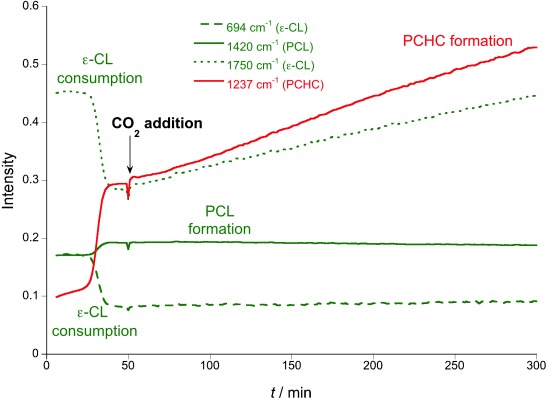
Changes to the intensity of IR resonances during PCL-PCHC formation (Table 1, run 5). The plot shows the ROP of CL, the addition of CO2, and the ROCOP of CHO/CO2.

Changes to the intensity of IR resonances during PCL-PCHC formation (Table 1, run 5). The plot shows the ROP of CL, the addition of CO2, and the ROCOP of CHO/CO2.