Figure 1.

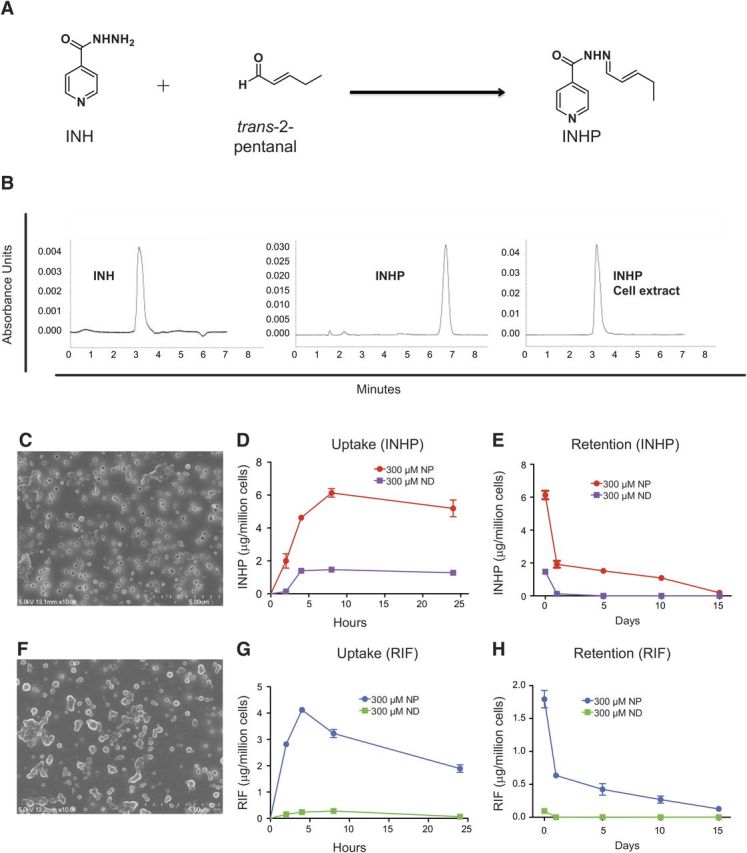
Synthesis of INHP, NP morphology, and comparison between NP and ND uptake and retention in MDM. A) Schematic of derivatization of INHP from INH. B) HPLC chromatograms of INH, INHP, and INHP after cell extraction. C, F) SEM images of INHP (C) and RIF (F) NPs. D, G) MDM uptake of 300 μM INHP (D) or RIF (G) NPs or NDs over 24 h. E, H) MDM retention of INHP (E) or RIF (H) over 15 d after treatment with 300 μM NPs or NDs. Data for cell uptake and retention are expressed as averages ± sem of n = 3 replicates.
