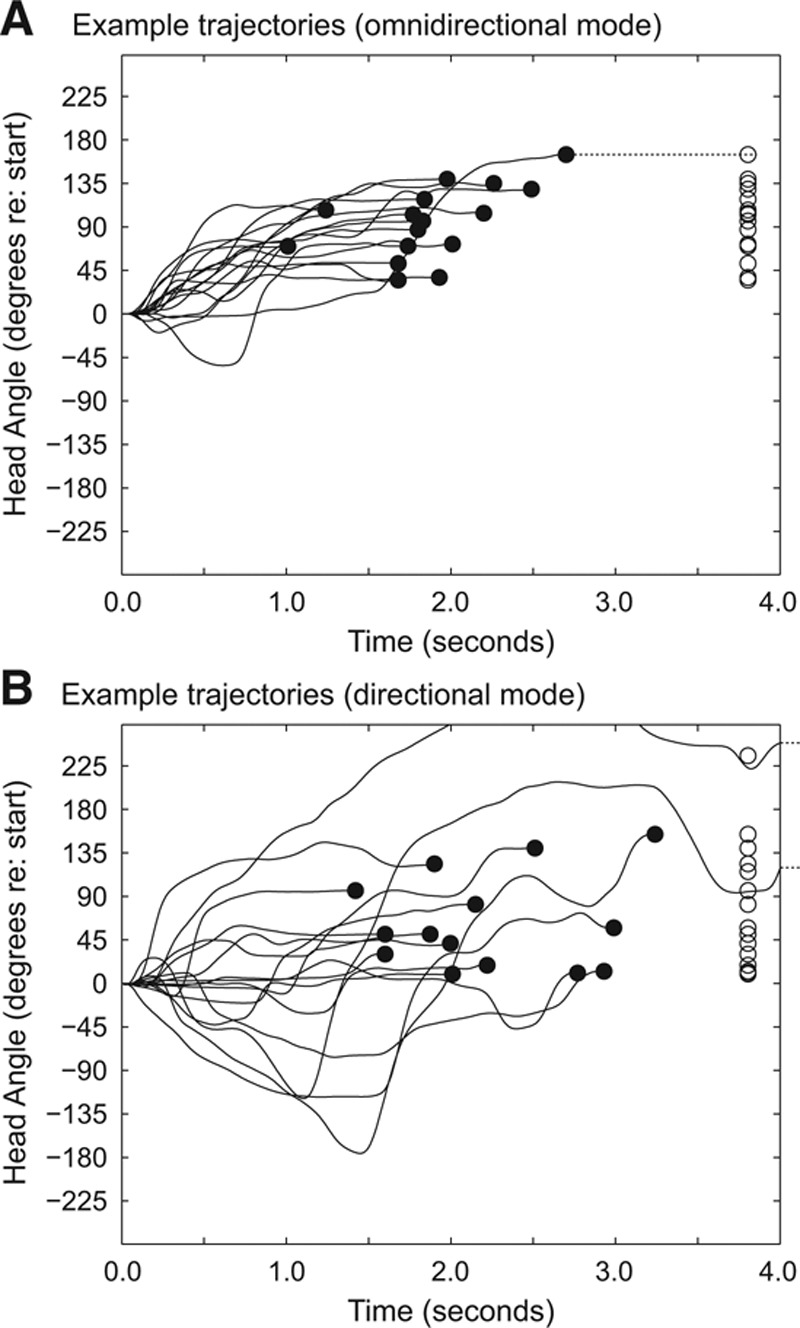
Fig. 3.

Representative movement trajectories toward a target at +60° while using omnidirectional mode (A) and directional mode (B). Individual lines represent head angle over time and the filled circles represent the endpoints (fixation angle and response latency) of these trajectories. The open circles are the fixation angles replotted to the right to more clearly show their distribution.
