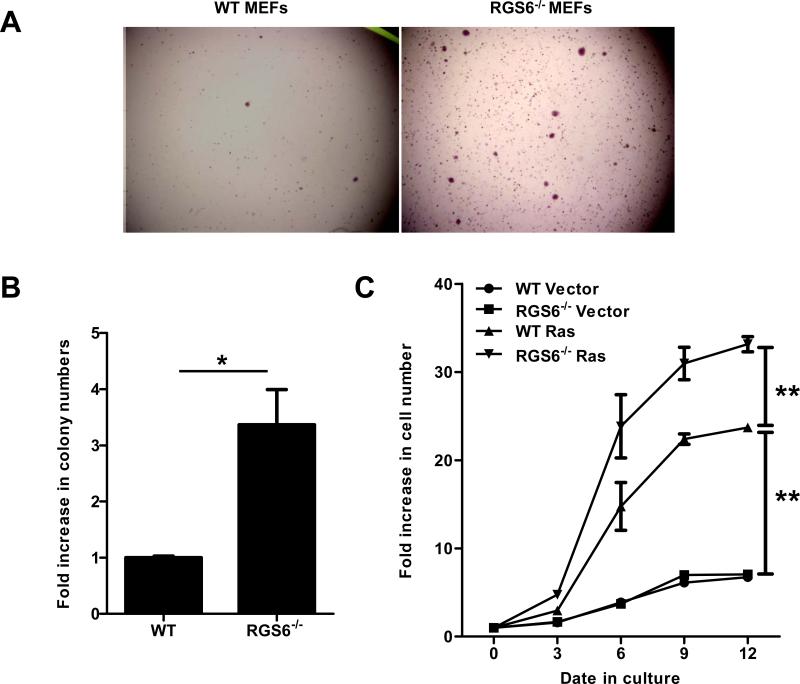
Fig. 1.
RGS6 blocks Ras-induced oncogenic cellular transformation. H-Ras(G12V)-induced colonies formed in soft agar by WT or RGS6−/− MEFs were quantified. Representative images are shown in (A) and numbers of colonies per well from three independent experiments are quantified and shown in (B). *, p<0.005 (student's t-test). All statistical analyses were performed with GraphPad Prism Software. Numbers of colonies formed by WT MEFs are set as 1. Growth rates of WT or RGS6−/− MEFs expressing either vector or H-Ras(G12V) were measured and shown in (C). Two-way ANOVA revealed a significant effect of genotype (F3,40 = 618.37; p<0.0001) and time (F4,40 = 561.27; p<0.0001). **, p<0.0001 (bonferroni multiple comparisons). Control viruses and viruses expressing H-Ras(G12V) or p53(R175H) were generated by transfection of 293T cells with empty pLWZ-Hygro or pBabe-Puro vector, or pLWZ-p53(R175H) or pBabe-H-Ras(G12V), together with packaging plasmids pAdv and Ψ2 via a standard Ca2+ phosphate transfection protocol with viruses harvested 24 h post-transfection. WT or RGS6−/− MEFs were incubated with virus-containing medium for 48 hrs and subjected to selection with 1.5 μg/μl Puromycin and 75 μg/μl Hygromycin for 72 hrs. After selection, MEFs were subjected to a soft agar assay according to a standard protocol, or were plated in triplicate in 6-well culture plates (1x10⁴ cells/well) and cell numbers determined at 3, 6, 9 and 12 days after plating. Data are presented as mean ± S.E.M.

