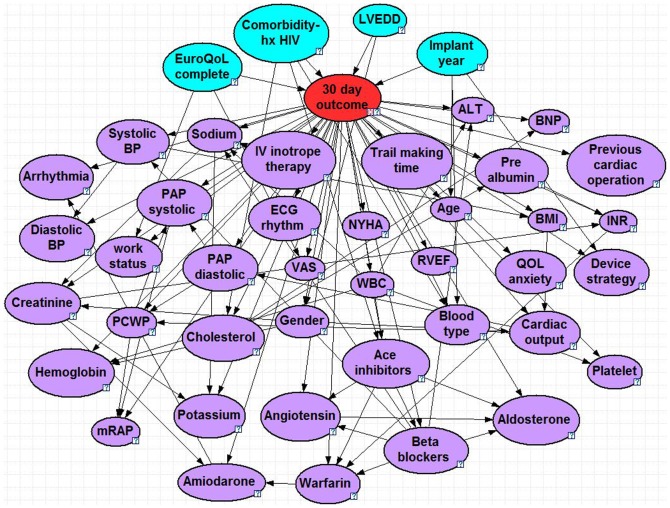
Figure 1. 30 Day Bayesian Model.
Node colors: red = class, blue = parent, purple = child. Question marks identify nodes that do not have specific evidence set and use the population distribution as the prior distribution. LVEDD = left ventricle end diastolic diameter, ALT = alanine transaminase, BP = blood pressure, mRAP = mean right atrial pressure, PCWP = pulmonary capillary wedge pressure, VAS = visual analog scale, BNP = B-type natriuretic peptide, WBC = white blood cell, NYHA = New York Heart Association functional class, RVEF = right ventricle ejection fraction, INR = international normalized ratio, BMI = body mass index, ECG = Electrocardiography, QOL = quality of life, hx HIV = history of human immunodeficiency virus.

