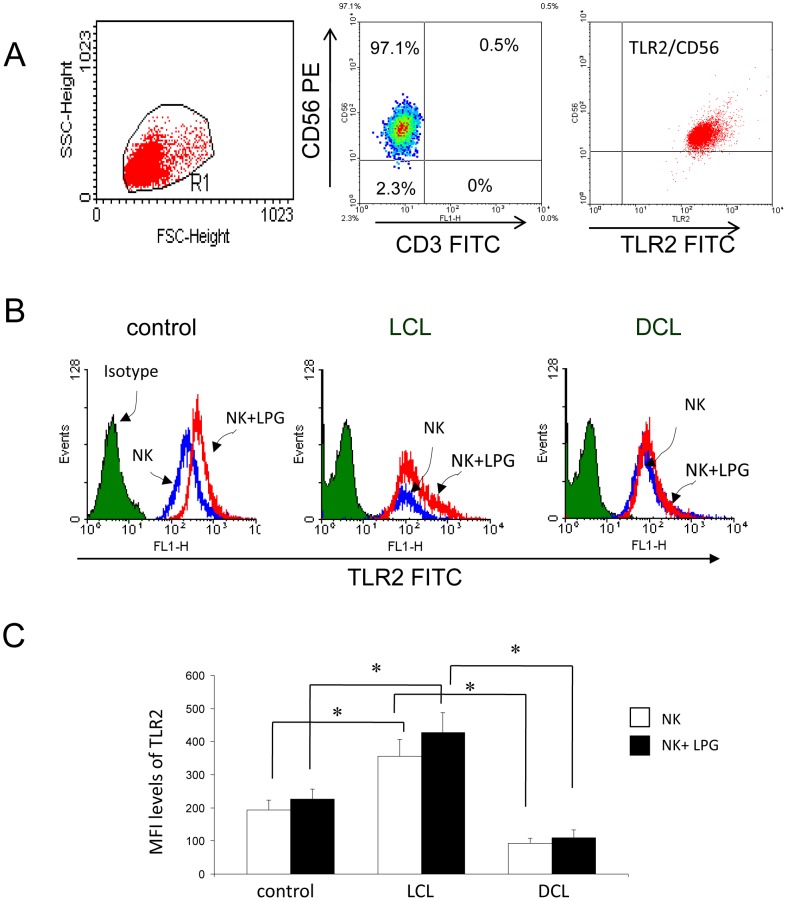
Figure 3. Analysis of TLR2 expression on NK cells.
(A) Representative flow CD56+/CD3- expression in membranes of NK cells; right image: NK cells were gated and analyzed for TLR2 (TLR2+/CD56+) expression. (B) Representative histograms showing the MFI levels of TLR2 expression on NK cells from control and patients (LCL and DCL). (C) Quantitation of TLR2 expression on NK cells. □ Non-stimulated cells, ▪ LPG-stimulated cells. Data are representative of healthy controls (n = 21), LCL patients (n = 28) and DCL patients (n = 6). These results are the mean ±SEM. *p≤0.05 was considered significant.

