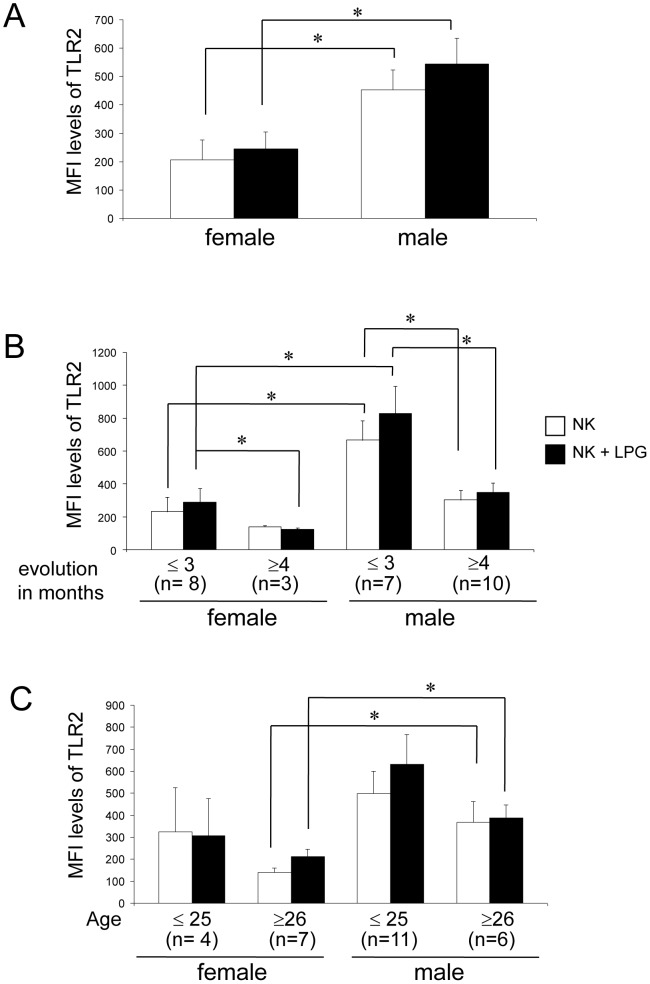
Figure 4. TLR2 expression in NK cells in LCL patients (n = 28).
Analysis according to: (A) gender, (B) disease evolution (≤3 or ≥4 months) or (C) age (≤25 or ≥26 years). □ Non-stimulated NK cells, ▪ LPG-stimulated NK cells. Cell surface expression is indicated by MFI. These results are the mean ± SEM. *p≤0.05 was considered significant.

