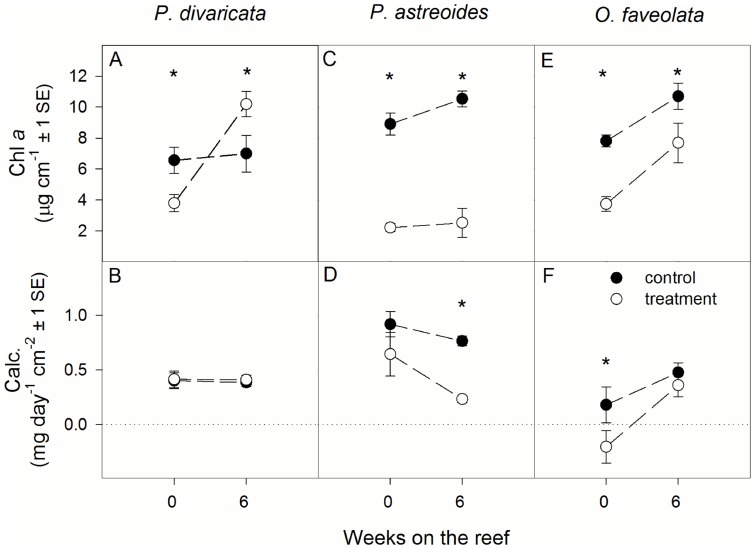
Figure 1. Average area-normalized chlorophyll a ( = chl a) concentration and calcification ( = calc.) rate of (A, B) Porites divaricata, (C, D) Porites astreoides, and (E, F) Orbicella faveolata after 0 and 6 weeks on the reef.
Asterisks indicate significant differences between control and treatment corals at a specific time interval. Sample size ranges from 6–9. Calcification data reproduced from Grottoli et al. [13] with permission of the publisher.

