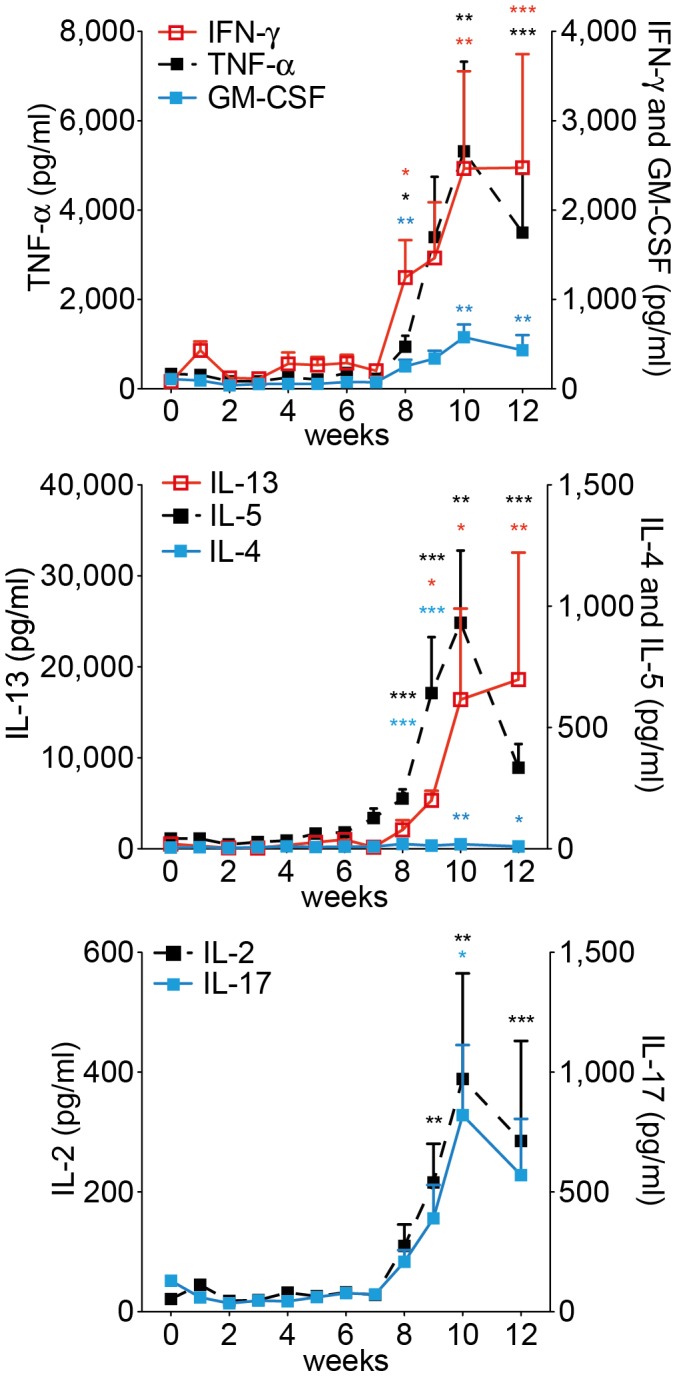
Figure 1. Serum cytokine levels of C57BL/6J mice infected with S. mansoni.

Cytokine levels were determined at indicated time points after infection. The data points represent means from 4–10 mice. Error bars represent SEM. Significant differences between each time point and control mice (day 0) are marked: *, p≤0.05; **, p≤0.01; ***, p≤0.001.
