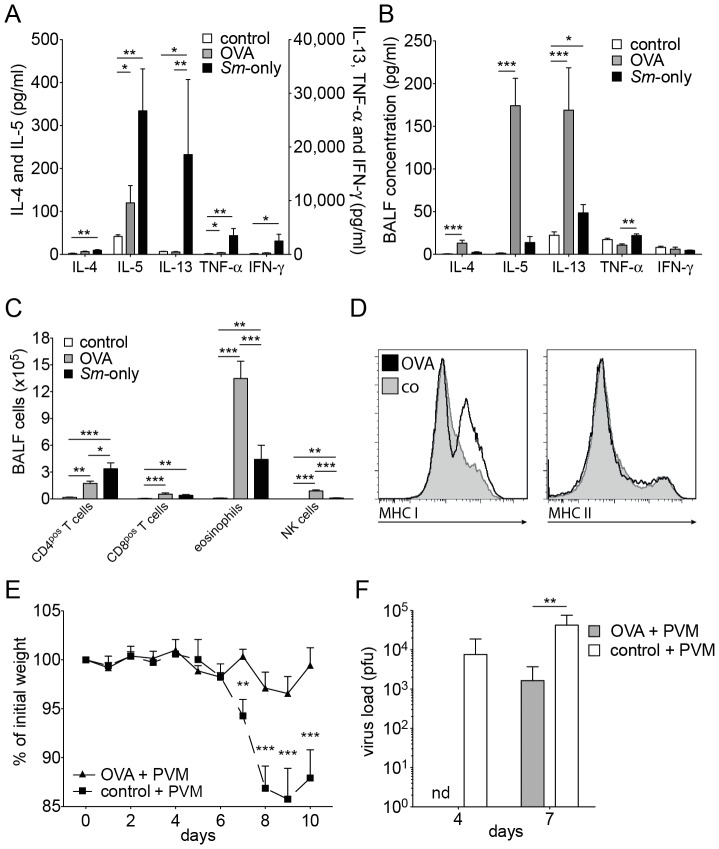
Figure 8. Resistance of C57BL/6 mice with inflammatory airway processes to challenge with PVM.
A, B, Cytokine levels in the serum (A) and BALF (B) 24 h after the last of 3 consecutive days of aerosolised OVA of OVA-immunised mice (C57BL/6J) compared to mice infected with S. mansoni and control mice. The data shown are pooled from 4–8 mice in 3 individual experiments; C, Number of cells of various cell types in the BALF of mice 24 h after the last of 3 consecutive days of treatment with aerosolised OVA of OVA-immunised mice (C57BL/6J) compared to mice infected with S. mansoni and control mice. The data are from 10–14 mice in 3–5 individual (depending on the time point) experiments; D, FACS profiles of the expression of MHC class I and II antigens on interstitial CD45pos CD11bpos SiglecFneg lung cells of C57BL/6J mice 24 h after the last of 3 consecutive days of aerosolised OVA challenge of OVA-immunised mice (thick lines) and control mice (shaded grey). Data shown is representative for 6 mice from 2 experiments; E, Relative weight loss of OVA-immunised mice (C57BL/6J) challenged with a sublethal dose (200 pfu/mouse) of PVM 24 h after the last of 3 consecutive days of aerosolised OVA and control mice at the indicated times after challenge. The data are cumulative from 10–16 mice in 3 individual experiments. The controls were obtained separately and are the same as in Fig. 7A. F, Viral load, expressed as pfu, in the right lobes of the lungs of mice, treated as described in Fig. 8E, at day 4 and 7 after challenge with PVM. The controls were obtained separately and are the same as in Fig. 7E. The data from OVA-immunised mice are derived from 2 and 3 mice (day 4 and 7, respectively). Error bars represent SEM. nd: not detectable. Significant differences are marked: *, p≤0.05; **, p≤0.01; ***, p≤0.001.

