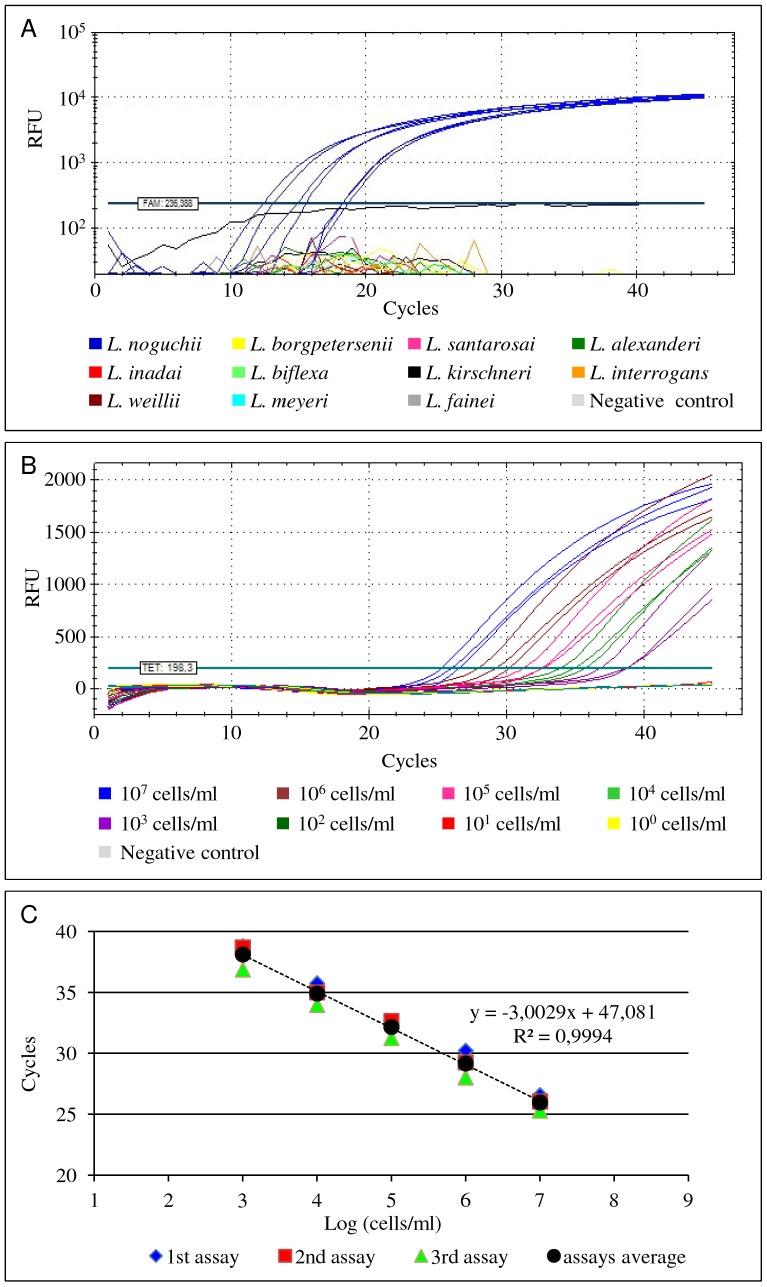
Figure 1. Illustration of the real-time PCR amplification curves obtained during the optimization of the assays.
(A) Specificity tests of the L. noguchii targeted amplification assay using the TaqLnog probe combined with the flanking primers FLnog2 and RLnog2. Blue amplification curves represent L. noguchii strains. All other non-target strains yielded no amplification results. (B) Estimation of the limit of detection of the amplification assay targeting L. interrogans (serovar Autumnalis, strain Akiyami) using DNA extracted directly from spiked bovine kidney samples as template as a typical example of all Leptospira probe and primer sets. The amplification curves obtained from different ten-fold serial dilutions of the target Leptospira are represented by different colours. Unspiked tissue homogenate (grey line) was used as negative control. (C) Standard curve obtained from the analysis of the amplification curves mentioned in the previous panel B. RFU - Relative Fluorescence Units.

