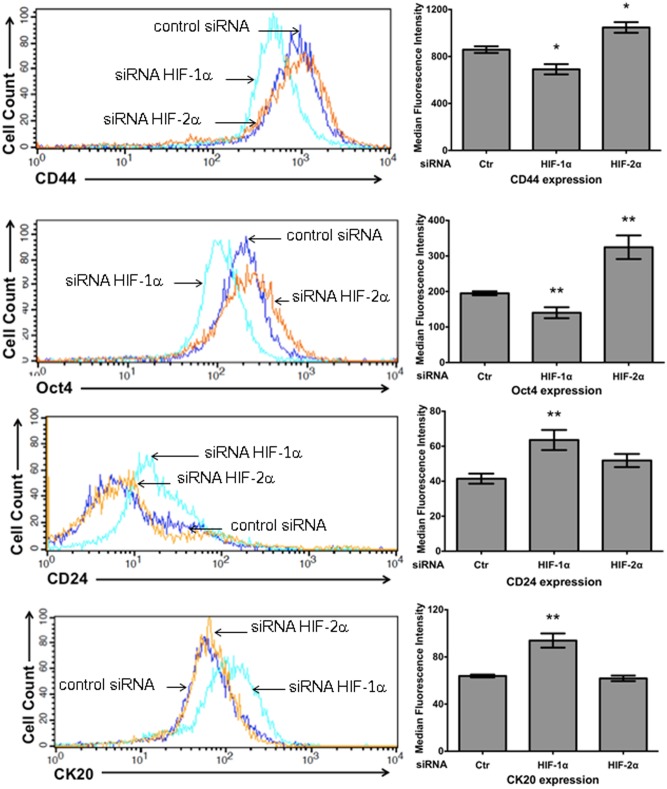
Figure 9. HIF-1α and HIF-2α knockdown exerted opposing effects on the expression of the stem cell markers CD44 and Oct4, but only HIF-1α depletion increased the expression of the differentiation marker CK20.
Stable control (scrambled shRNA plasmid) or HIF-1α- or HIF-2α- silenced SW480 cells were incubated in the presence of EDTA, washed, and incubated with mouse anti-CD44, rabbit anti-Oct4, mouse anti-CD24 or mouse anti-CK20 antibodies. The cells were washed, stained with Alexa 647-conjugated goat anti-mouse/rabbit secondary antibody, and examined by flow cytometry. The figure shows the overlapping histograms of labeled SW480 control cells (blue line and Ctr in each bar graph), HIF-1α-knockdown cells (green line), and HIF-2α-knockdown cells (orange line). A representative histogram of the data is shown, and the bar graphs represent the means of the median fluorescence intensity ± SEM from at least four independent experiments. *: p<0.05; **: p<0.01.

