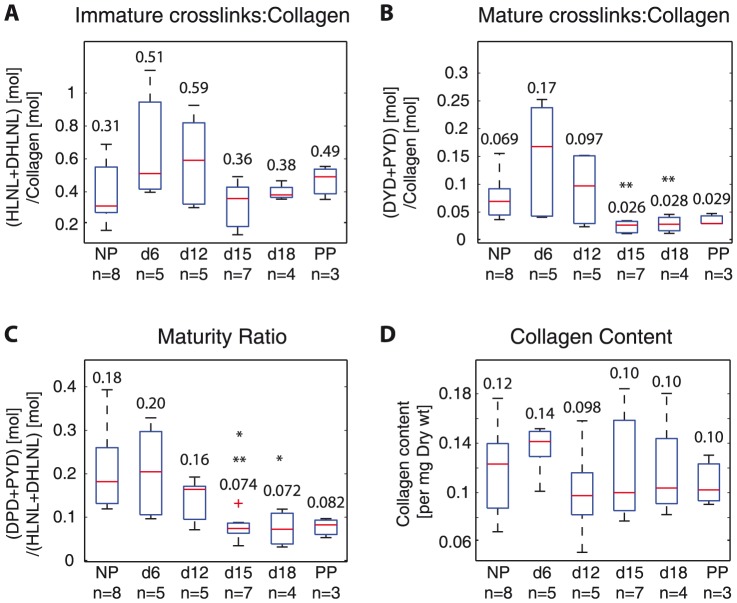
Figure 3. Collagen crosslinks increase in early pregnancy and decrease by late gestation, leading to decreased maturity ratios in late pregnancy.
Averaged crosslink density (normalized by collagen) measured with UPLC-ESI-MS/MS for all samples for A) total immature crosslink density (HLNL+DHLNL) B) total mature crosslink density (DPD+PYD), C) maturity ratio (total immature crosslink density: total mature crosslink density), and D) collagen content (per dry weight). * and ** represents statically significant difference compared to NP and d6 respectively. (One-way ANOVA  ). NP = nonpregnant, d6, d12, d15, d18 = gestation day 6, 12, 15, 18, PP = postpartum. Numbers on top or below boxes are median values for each group.

