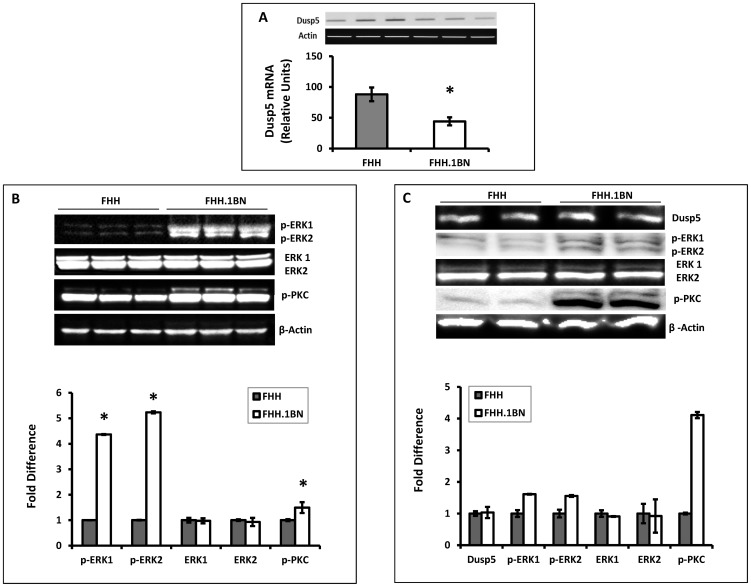
Figure 3. Comparison of the expression and activity of Dusp5 in FHH versus FHH.1BN rats.
Panel A presents a comparison of the expression of Dusp5 mRNA in cerebral arteries of FHH versus FHH.1BN rats. The upper portion of the figure presents the representative images of gels showing the qPCR products and the bar graph below compares the expression levels. Panel B presents a comparison of the expression of phosphorylated-ERK1/2, total ERK1/2, phosphorylated-PKC and beta-Actin in the brain of FHH and FHH.1BN rats. The upper panel presents the representative images and the lower panel presents the relative quantitation. Panel C presents a comparison of expression of these proteins in cerebral microvessels of FHH as compared with FHH.1BN rats. All of the vessels isolated from one strain were pooled into a single sample. The upper panel presents the representative images and the lower panel presents the quantitation of the images. Mean values ± SE from 3 rats per strain are presented in Panel A and Panel B. Panel C represents the results from duplicate aliquots run from a single pooled microvessel sample isolated from 8–10 rats per strain. * indicates a significant difference from the corresponding value in FHH rats.

