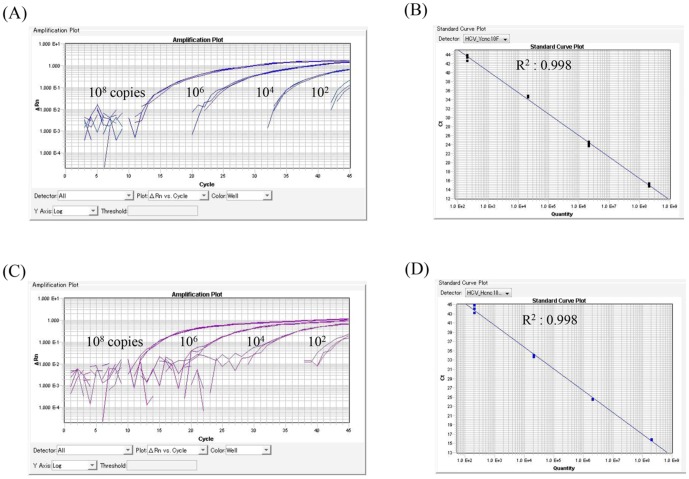
Figure 1. Real-Time PCR Analysis Using a Synthesized Oligonucleoside Following Adjustment for a 100-fold Dilution Series from 1×10² to 1×10⁸ copies/mL.
(A) Amplification plots using SYN-NS5A_Ycac. (B) The standard curve for SYN-NS5A_Ycac generated from the amplification plots displayed in Fig 1A. The correlation coefficient was 0.998. (C)Amplification plots using SYN-NS5A_Hcac. (D) The standard curve for SYN-NS5A_Hcac. The correlation coefficient was 0.998. All figures were generated by the ABI Psism 7900 Sequence Detection Software (SDS), version 2.4.

