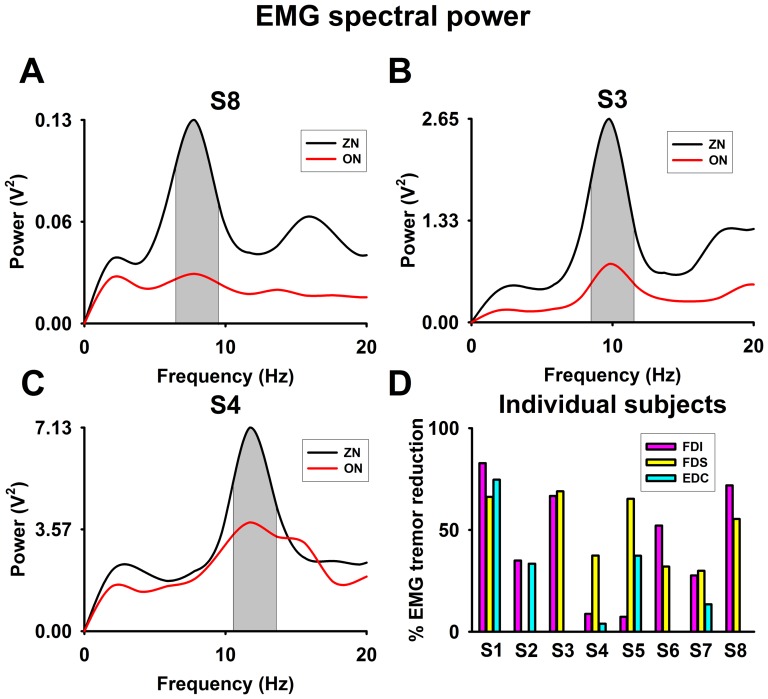
Figure 3. EMG spectral power for zero noise (ZN, black) and optimum noise (ON, red).
(A–C): Power spectra for FDI muscle activity for subject 8 and for FDS muscle activity for subjects 3 and 4 with ZN and ON, highlighting the tremor frequency. (D) For all eight subjects, effect of ON on the EMG power spectra (i.e. % of EMG tremor reduction) of FDI, FDS, EDC muscles (at the individual tremor frequency).

