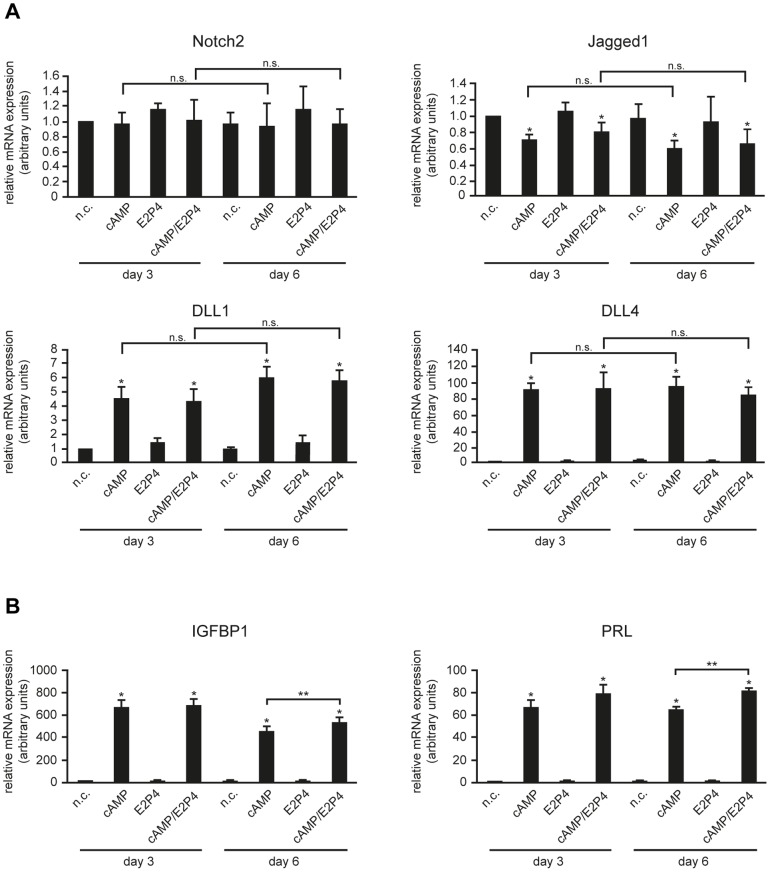
Figure 2. qPCR measuring mRNA expression of Notch2 receptor and Notch ligands (A) and decidual markers IGFBP1 and PRL (B) in differentiating HDSC.
Cultures were incubated for 3 and 6 days with cAMP, E2P4 or cAMP/E2P4. Cells without stimuli were cultivated in parallel representing non-stimulated controls (n.c.). For relative quantification of mRNA expression, n.c. of day 3 was arbitrarily set to 1. Bars depict mean values ± S.D. of 4 different experiments. PCR reactions were performed in duplicates. * depicts p≤0.05 compared to the n.c. of day 3; n.s., not significant. ** indicates p≤0.05 between cAMP and cAMP/E2P4-treated cultures at day 6.

