
Figure 3. Transcriptional signalling is not monotonically related to net cAMP levels.
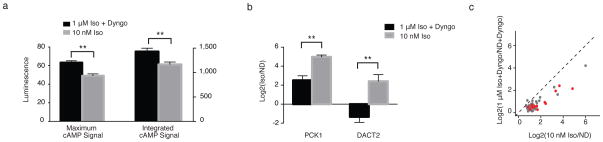
(a–c)B2-AR was activated by bath application of 10 nM or 1 μM isoproterenol in the presence of 30 μM Dyngo to block endocytosis. (a) Maximum and integrated cAMP signal was measured with the enzyme-based biosensor pGLO-20F (Promega). Data = mean from n = 2–3 experiments. (b–c) Transcriptional induction of (b) PCK1 and DACT2 or (c) isoproterenol target genes was determined by qRT-PCR or microarray analysis, respectively. In grey – isoproterenol targets, in red – endocytosis-dependent genes (Supplementary Table 3), dotted line has a slope of 1 (y = x). Data = averaged log2 ratios (Iso/No Drug) from n = 2 experiments for each condition. Iso = isoproterenol, ND = no drug ** p < 0.005 by unpaired t-test; error bars = ± s.e.m.