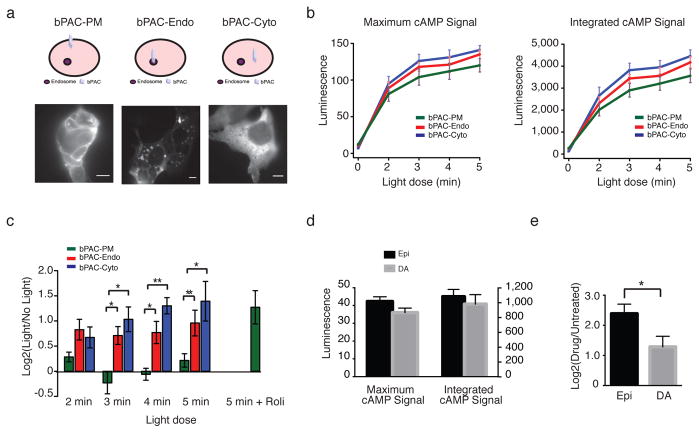
Figure 4. Localized cAMP production causes distinct transcriptional responses.
(a) bPAC constructs were targeted to the plasma membrane (“bPAC-PM”), endosomes (“bPAC-Endo”), or cytoplasm (“bPAC-Cyto”) and visualized by immunofluorescence microscopy with Alexa-conjugated anti-myc antibody in fixed HEK293 cells. Scale bar = 10 μm. (b) Maximum and integrated cAMP signal after bPAC activation was measured with the luminescence-based biosensor pGLO-22F (Promega). Data = mean from n = 4–5 experiments. (c) PCK1 expression was measured by qRT-PCR before (“No Light”) or after activation of bPACs (“Light”) with indicated doses of light. The PDE4-specific inhibitor rolipram (“Roli”) was added to final concentration of 10 μM to cells immediately prior to exposure to light. Data = average from n = 4–5 experiments. (d) Maximum and integrated cAMP signal after treatment of cells with 10 nM epinephrine (“Epi”) or 10 μM dopamine (“DA”) was measured with the luminescence-based biosensor pGLO-20F (Promega). Data = average from n = 3 experiments. (e) PCK1 expression measured by qRT-PCR after treatment with 10 nM epinephrine or 10 μM dopamine. Data = mean from n = 5–7 experiments. ** p < 0.005, * p < 0.05 by unpaired t-test; error bars = ± s.e.m.

