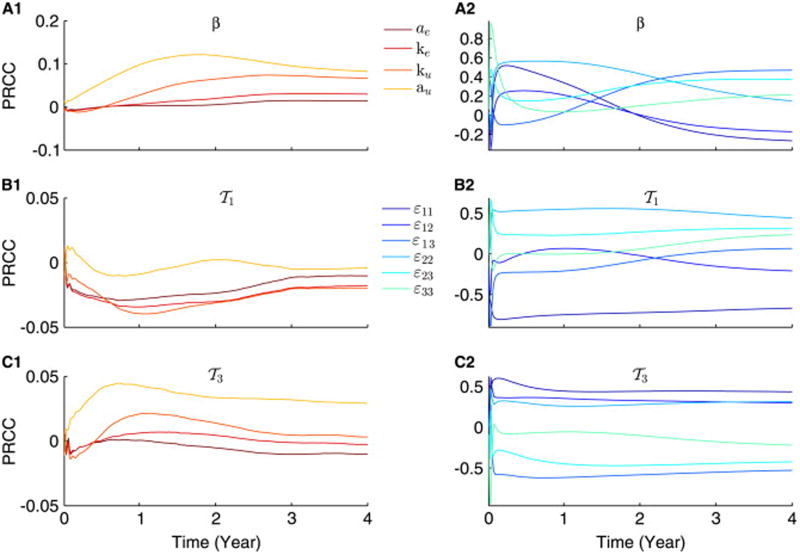
Fig. 2.
Progression of PRCCs of the scaled model, described by Eqs. (9)–(11), over time, illustrating how sensitive the model is towards both ER-stress-dependent processes and nonuniform competition. PRCCs of β (A1 and A2),
 1 (B1 and B2) and
 3 (C1 and C2) are performed for the following two sets of parameters {ae, ke, au, ku} (A1–C1) and {ε11, ε12, ε13, ε22, ε23, ε33} (A2–C2). Each color corresponds to one parameter as illustrated by the two legends. (For interpretation of the references to color in this figure caption, the reader is referred to the web version of this paper.)

