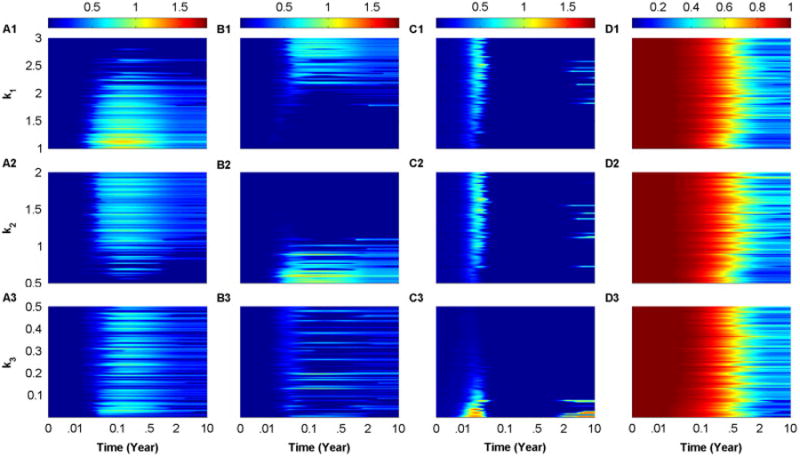
Fig. 5.

Heat-map simulations of the scaled model, described by Eqs. (9)–(11), at κ = 5 × 10⁻⁹(day cell)−1. The 10-year time evolution of
 1 (A1–A3),
 2 (B1–B3),
 3 (C1–C3) and β (D1–D3) are displayed. The color-coding in each panel is quantified by the color-bars on the top of each column. The simulations are performed by applying LHS over the following ranges: k1 ∈ [1, 3] (A1–D1), k2 ∈ [0.5, 2] (A2–D2) and k3 ∈ [0.01, 0.5] (A3–D3), given that the inequality k1 ≥ k2 ≥ k3 is always maintained. Notice that the random sampling performed by LHS makes small perturbations in the values of ki, i = 1, 2, 3, have significant implications on the number of surviving beta-cells. (For interpretation of the references to color in this figure caption, the reader is referred to the web version of this paper.)
