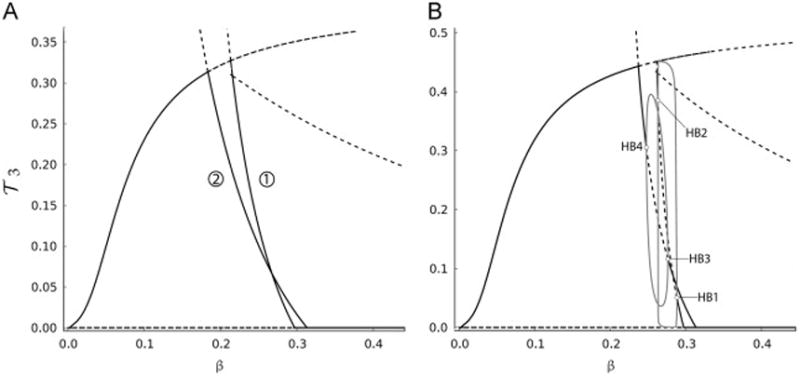
Fig. 6.

Bifurcation diagrams of
 3, described by Eq. (11), with respect to β, the slowly varying variable in the presence of uniform (A) and nonuniform (B) inter-clonal competitions. To generate nonuniform competition in (B), the following values for the competition scaling factors are used: ε12 = 3, ε13 = 1.1 and ε33 = 0.782. Solid-(dashed-) black lines in panels (A) and (B) represent stable (unstable) steady states and gray-solid lines in panel (B) represent the branches of stable periodic orbits emerging from supercritical Hopf bifurcation points (HB1, HB2, HB3 and HB4). The two panels are truncated at β = 0.45 to magnify the bifurcation diagrams for small β, and because higher values of β do not alter the stable steady state
 3 = 0. As indicated, nonuniform competition induces oscillations in
 3.
3.
