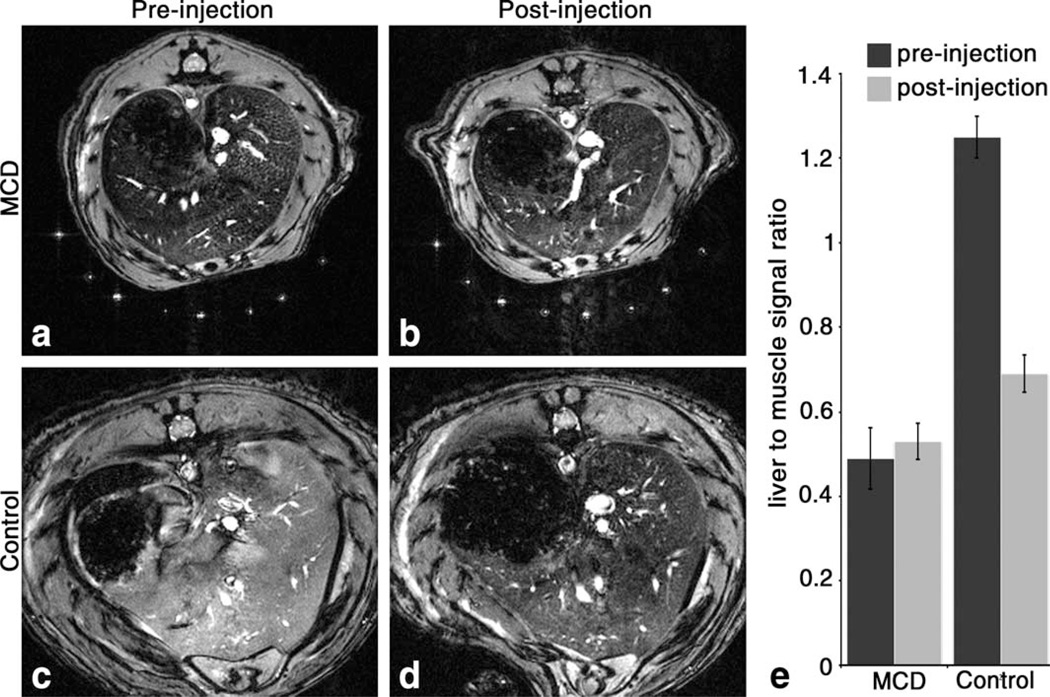
FIG. 5.
Reduced CF-labeling of the perisinusoidal ECM of the liver is detectable in vivo in the rat model of NASH using -weighted MRI. In vivo MRI shows darkening in the images of MCD liver tissue before injection of CF compared to naive control (a and c). Signal magnitude did not change in liver tissue of MCD rats after injection of CF (b), while substantial darkening of liver tissue occurred in control rats after CF injection (d). To quantify the group differences, the liver signal was compared to surrounding muscle (e). Liver to muscle signal ratios from MRIs of pre- and post-injection control rats are statistically different, but pre- and post-injection ratios from rats fed with the MCD diet are not (α = 0.05). n = 6 for each group. Error bars equal ± the standard error of the mean.

