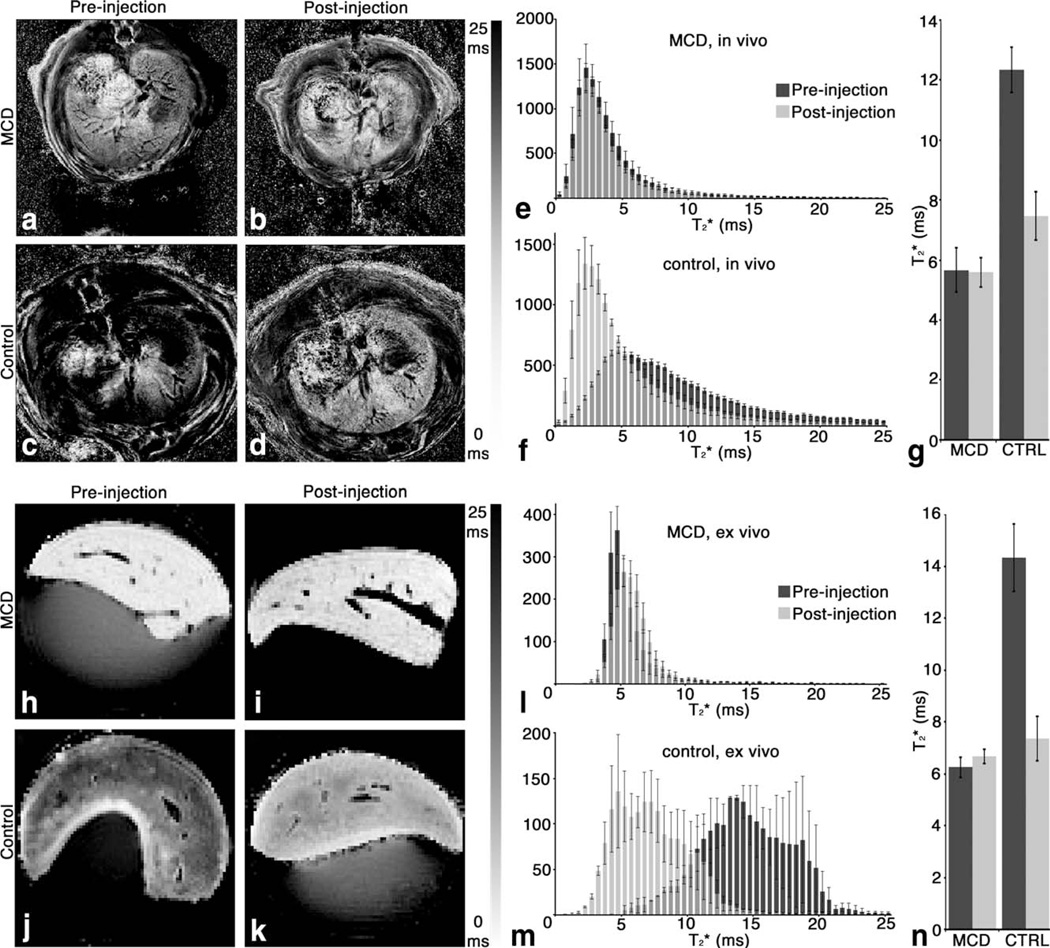
FIG. 6.
Reduced CF-labeling of the perisinusoidal ECM of the liver in the rat model of NASH is detectable in vivo and ex vivo by generating maps of measured (a–d, h–k). Histograms (e, f and l,m) of in the entire liver show a broad shift in in control rats after injection of CF, both in vivo and ex vivo. No such shift was seen in MCD-fed rats. A significant (α = 0.05) reduction in average in vivo and ex vivo (g, n) was observed after CF injection in livers from rats fed the control diet. did not change significantly after CF injection in livers from rats fed with the MCD diet. n = 6 per group for in vivo measurements. n = 2 for the ex vivo pre-injection control group. n = 3 for the ex vivo pre-injection MCD-fed group. n = 6 for both ex vivo post-injection groups. Error bars equal ± the standard error of the mean.

