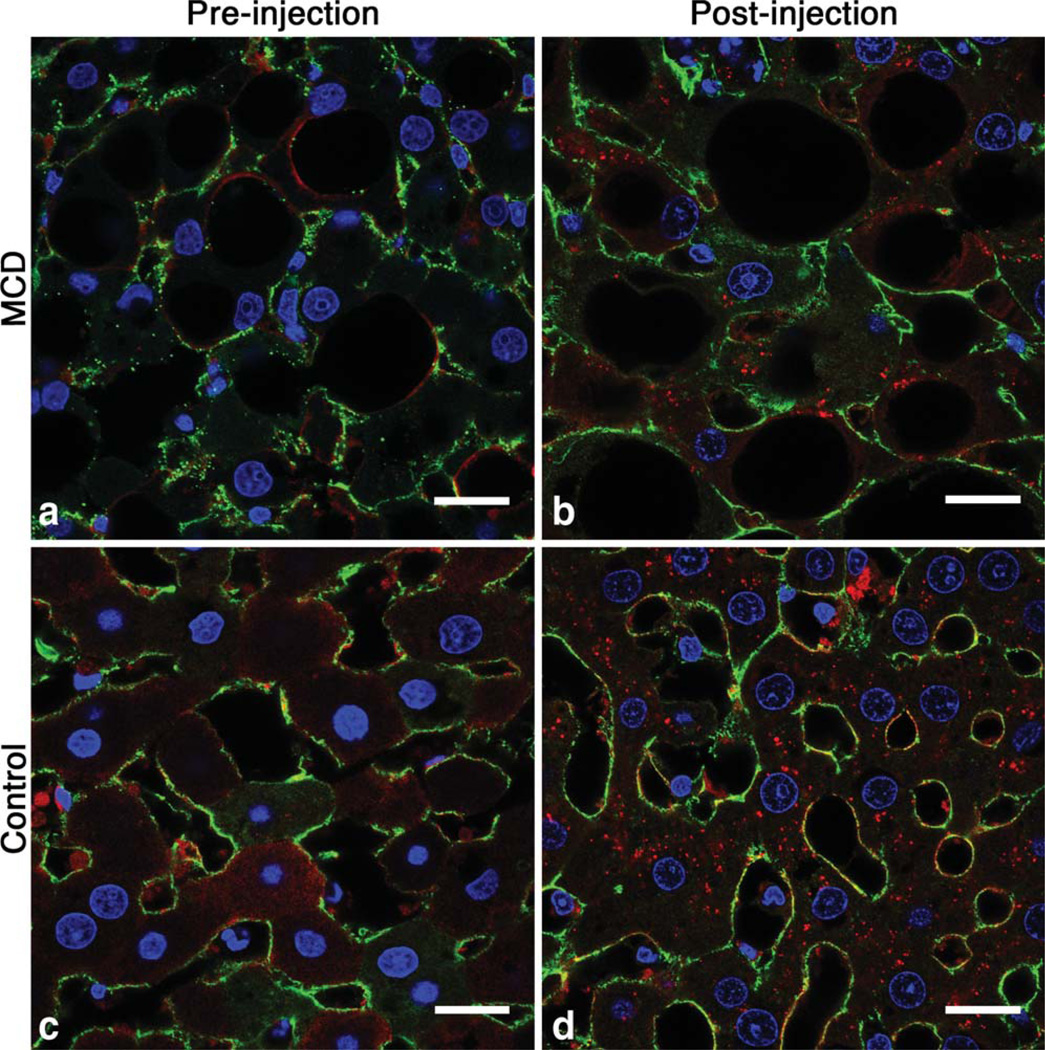
FIG. 7.
Distinct differences in the spatial distribution of intravenously delivered CF are apparent between the livers of healthy rats and rats fed with the MCD diet (b,d), as observed with immuno-fluorescent microscopy. Reduced ferritin IF in the livers from rats fed the MCD diet compared to controls indicated reduced CF-labeling with NASH. The ECM (green) pattern in MCD livers appears redistributed compared to control livers due to thickening and displacement by lipid droplets (a,c). Tissue was collected from animals 3 h after CF administration. Cell nuclei are stained with 4’,6-diamidino-2-phenylin-dole and fluoresce blue. Scale bar = 20 µm.

