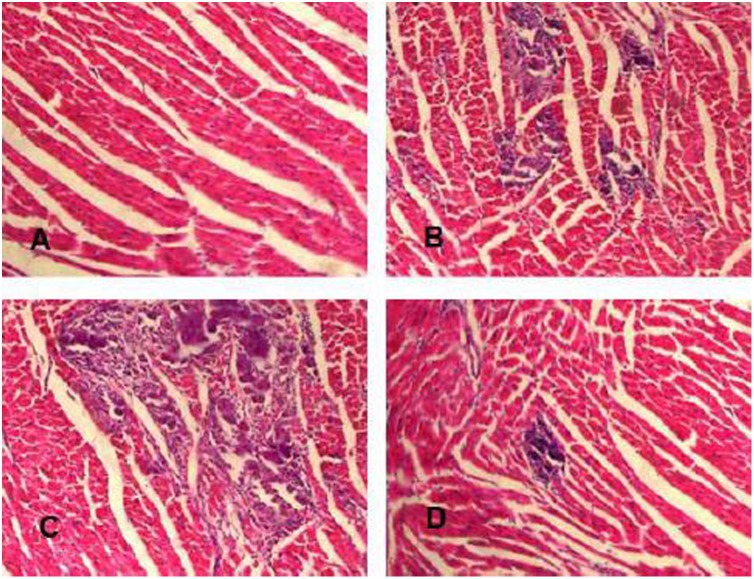
Figure 2. Myocardial histopathology (Hematoxylin Eosin×200) in the heart.
(A) Histopathology of control group (grade 0). (B) Representative histopathology of myocarditis group. The extent of lesions was less severe in the myocarditis group than in the methyllycaconitine group; several small foci of cellular infiltrations in the inflammatory region are shown (grade 2). (C) Representative histopathology of methyllycaconitine group. The extent of lesions was the most severe; large foci of cellular infiltrations in the inflammatory region were observed (grade 3). (D) Representative histopathology of nicotine group. The area of cellular infiltrations was much smaller and limited in the inflammatory region than in the myocarditis group and methyllycaconitine group (grade 1).

