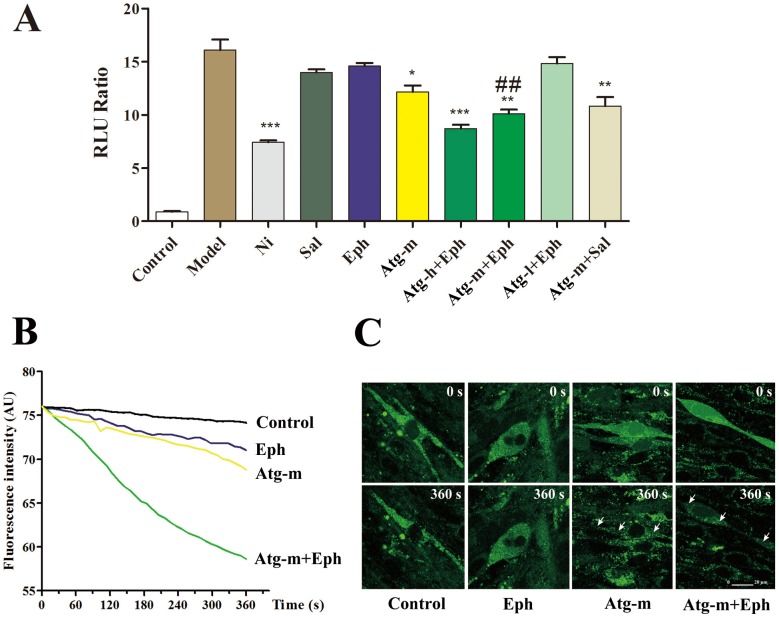
Figure 5. The synergistic mechanism of Atg and Eph in reducing the intracellular calcium concentration, asevaluated by the dual luciferase reporter assay system (A), confocal microscopy fluorescence intensity analysis (B) and image observations (C).
The white arrowindicates a significant [Ca2+]i intensity decrease in a singleHBSMCcell. The values are presented as the mean ± SEM (n = 5). *P<0.05, **P<0.01, ***P<0.001, compared to the model group (M); ## P<0.01, compared to the Eph group.

