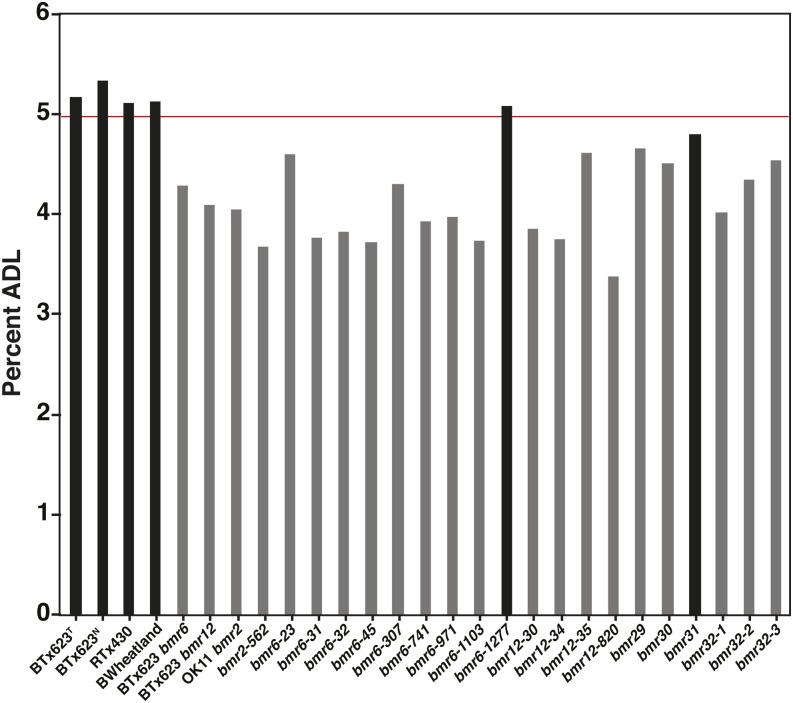
Figure 4.
Acid detergent lignin (ADL) concentrations were determined by NIRS prediction based on the calibration equation (Table S1). Additional details are found in the Materials and Methods section. The values presented are least squares means (lsmean) for bmr mutant and check lines (Table S4). Gray bars indicate values that were statistically significantly different (P ≤ 0.20) from the values of BTx623T, the line used for mutagenesis. The red line indicates lower limit of all ranked variables for WT (BTx623T). Additional details of the statistical analysis are described in the Materials and Methods section.

