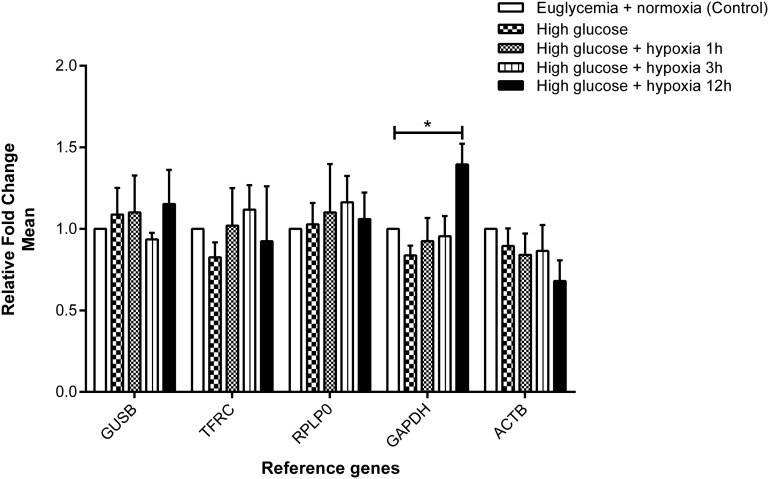
Figure 3.
Effect of hyperglycemia and hypoxia on gene expression of the selected reference genes. Fold change in gene expression analyzed by the 2−∆CT method. Data are mean ± SEM, n = 3–4, *P < 0.05 vs. control. Expression of GUSB, TFRC, RPLP0, and ACTB was found to be stable, whereas GAPDH was increased with borderline significance after 12 hr of hypoxia compared with the control.

