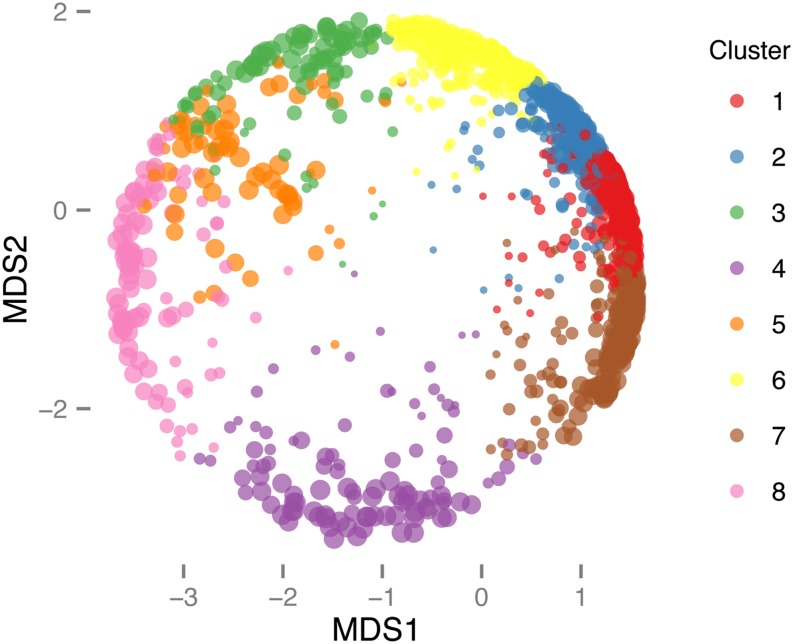
Figure 2.
Multidimensional scaling (MDS) of standardized, log-transformed FPKM values of clustered genes, scaled by α, which is the gene’s membership value for the cluster to which it was assigned, larger points having α values closer to 1. The clusters are supported by the MDS analysis. FPKM, Fragments per kilobase of exon per million fragments mapped.

