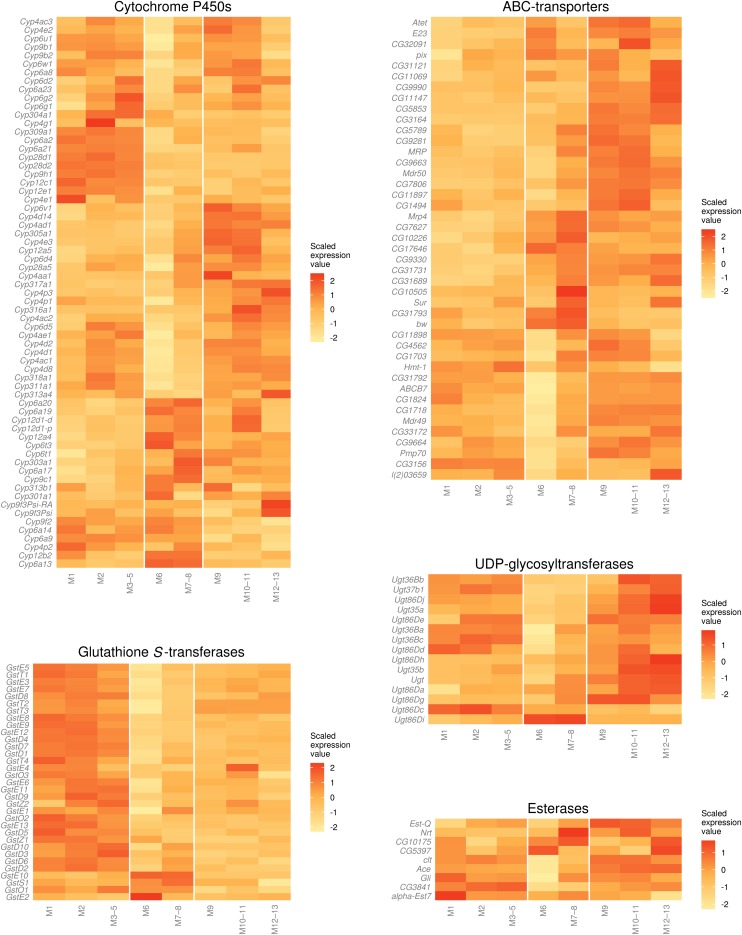
Figure 3.
Expression of metabolic gene families and ABC transporters in the midgut. Expression values are log10(FPKM + 1), scaled by each gene’s total expression across the 8 subsections. Unscaled FPKM values for these genes are provided in File S2. Genes with low or undetectable expression (sum of FPKM values less than 1) were excluded from the analysis. In general, members of these gene families are not enriched in M6, but there are exceptions, and other patterns of expression within the families were observed (Xenobiotic metabolism in the midgut). FPKM, Fragments per kilobase of exon per million fragments mapped.

