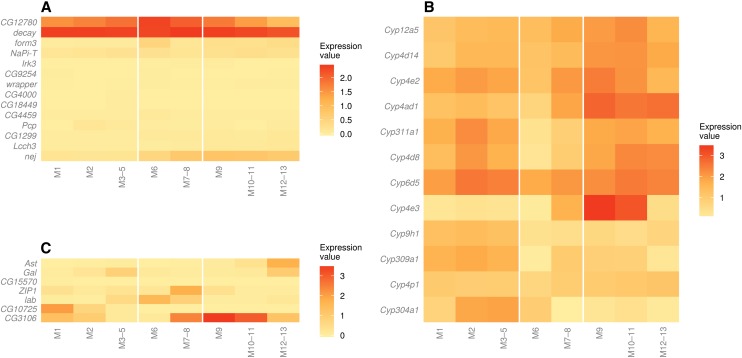
Figure 5.
Comparison of the transcriptome data set with three other data sets. Heat maps were produced from the larval midgut dataset for the following groups of genes: (A) genes with restricted expression patterns, chosen from FlyAtlas (Chintapalli et al. 2007), (B) 12 P450 genes that were found by RNA in situ hybridization to be expressed in subsections of the midgut (Chung et al. 2009), and (C) genes used to exclude cross-contamination in RNA from subsections of the adult midgut (Marianes and Spradling 2013). The expression patterns of these genes indicate that the midgut subsections were adequately dissected. Expression values are unscaled log10(FPKM + 1).

