Figure 4.
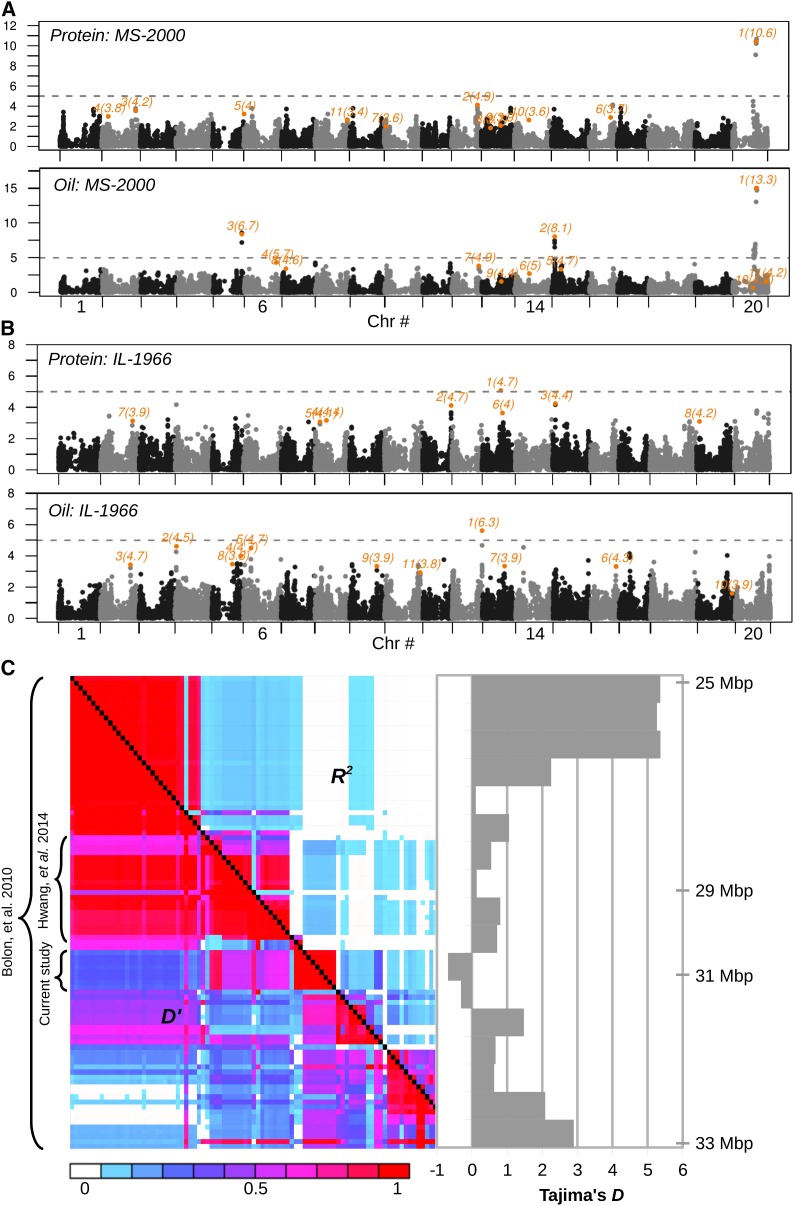
Percent protein and oil GWA scan. For population MS-2000 (A) and IL-1966 (B), each marker is plotted with its -log(p-val), as assessed using the CMLM method, on the y-axis and its physical position is plotted on the x-axis. Orange color indicates markers also identified by the MLMM method; their discovery order and -log(p-val) are also indicated in adjacent orange font. Chromosomes are indicated by alternating black and gray and are plotted in order, 1 through 20. A significance threshold of p-value < 10−5 is indicated by a dotted line. (C) Using MS-2000 population, LD plot for the region around the protein/oil QTL identified in this study and others. The total physical distance shown is ∼8 MB. R2 and D′’ measures of LD are given above and below the diagonal, respectively; both values range from 0 to 1. Brackets indicate the physical range previously found to associate with protein and oil content. The bar graph to the right of the LD plot is scaled approximately to the physical position along the LD plot, as indicated, and plots the Tajima’s D metric for sliding windows 20 markers wide with an overlap of 10 markers. Both monomorphic and polymorphic markers were included in the Tajima’s D calculation, whereas only polymorphic (MAF > 0.05) sites are shown in the LD plot.

