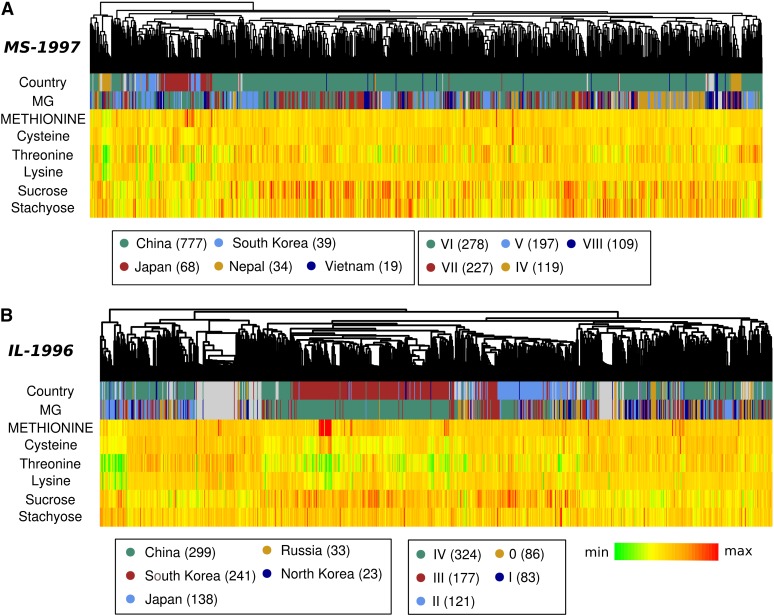
Figure 6.
Attributes of populations used in GWA scans for seed quality traits. Genotypes were clustered based on genetic distance. Each genotype used in the study represents a leaf in the dendrogram at the top of each panel. Country of origin and maturity group (“MG”) are color-coded. Traits are represented as a heat map, with red being the highest value within a population and green being the lowest. Values in parentheses indicate the number of lines within a given category. (A) MS-1997 population. (B) IL-1996 population. Note that color-coding can be different for the same category in different populations.

