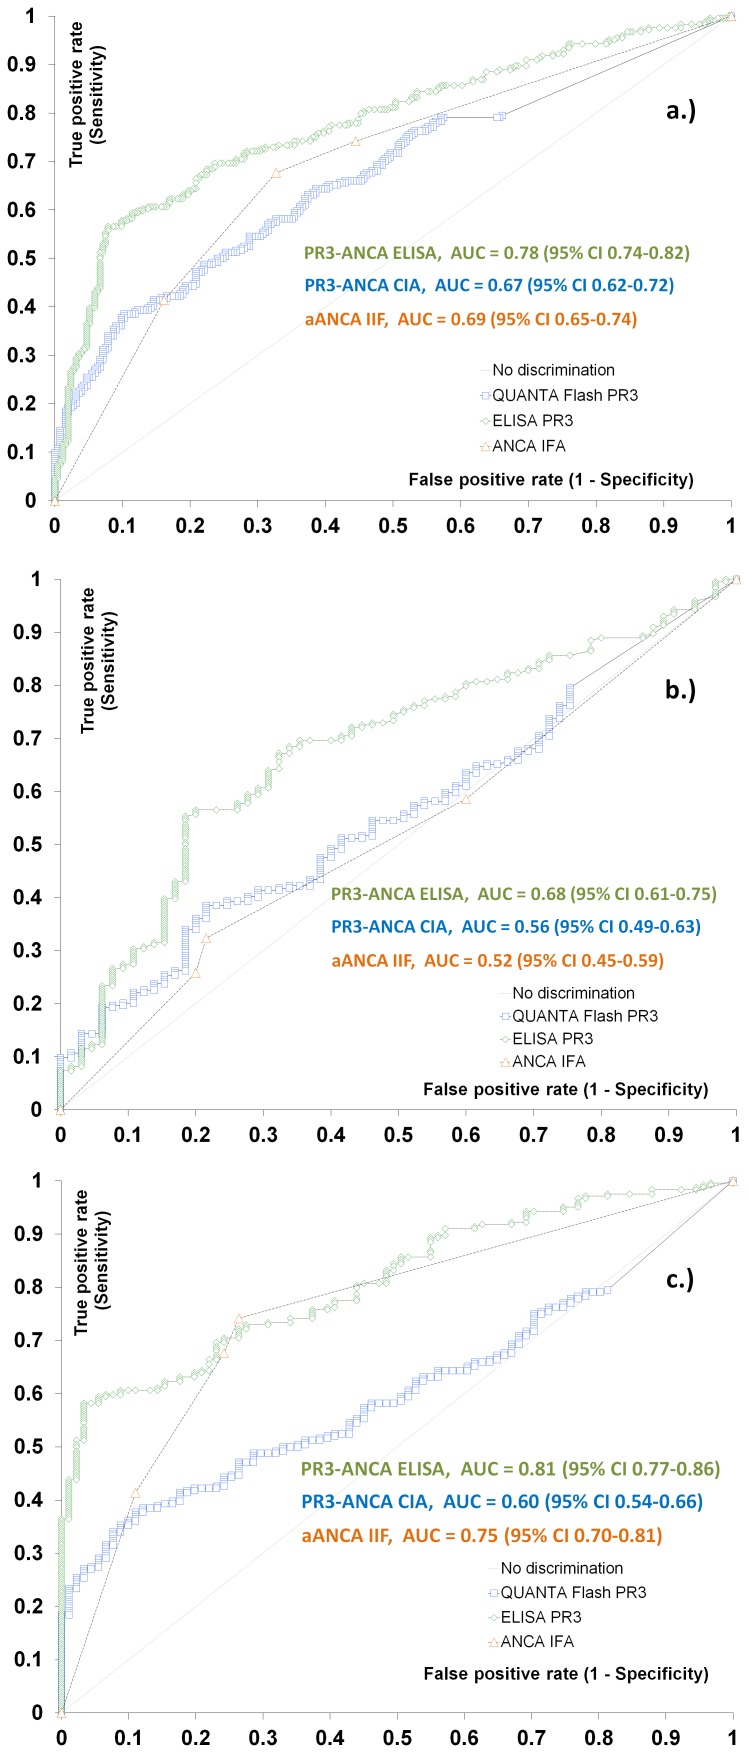
Figure 1. Comparative receiver operating characteristic (ROC) curves analysis.
Comparative ROC analysis is shown for PR3-ANCA by ELISA, chemiluminescence immunoassay (CIA) and ANCA by indirect immunofluorescence (pANCA). Primary sclerosing cholangitis (PSC) vs. all liver controls (a) and vs. autoimmune hepatitis (AIH) (b), and vs. primary biliary cirrhosis (PBC) (c). Area under the curve (AUC) and 95% Confidence Intervals (CI) values for the individual assays are presented in the figure.

