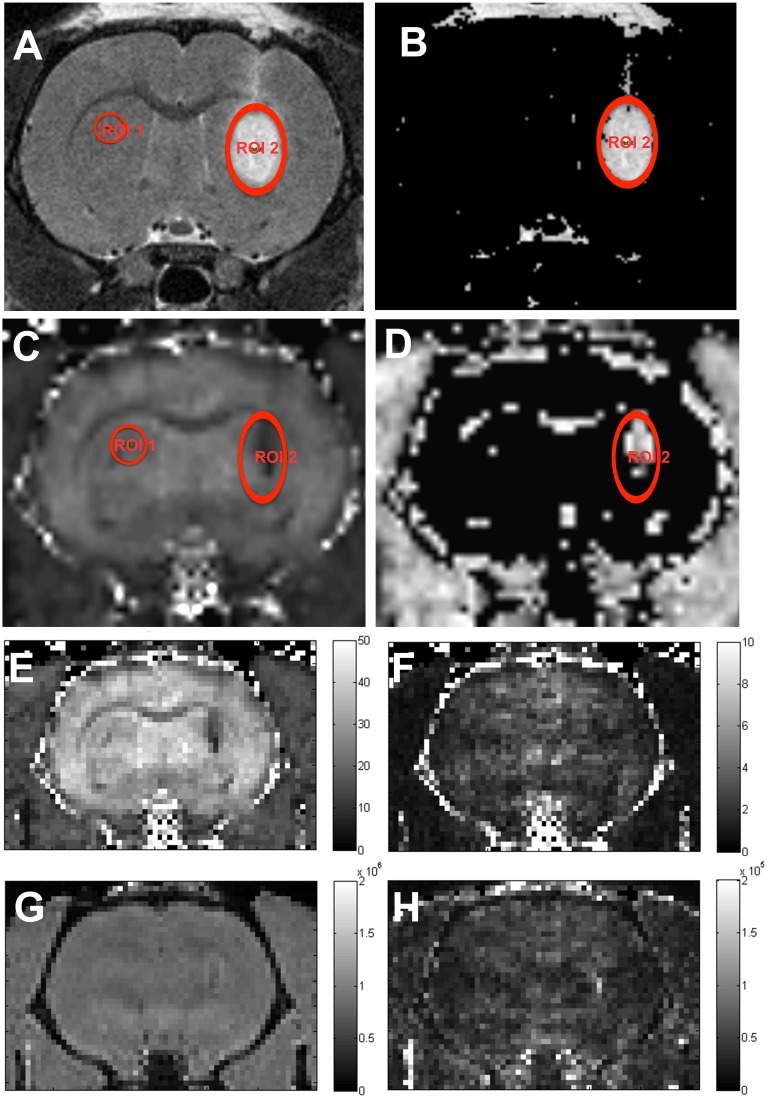
Figure 1. Image processing and ROI selection.
T2-WI (A) and T2*-maps (C) were processed into thresholded intensity (B) and T2* maps (D) to calculate areas of affected relaxation times. A control (ROI1) was selected in the unprocessed image and the mean intensity value was used as a reference to select affected pixels (B, D). Only voxels within ROI2 were included in the analysis. Also included are the non-smoothed results of the fit, presented as T2* parametric maps (E) and its standard deviation (F) (scale bars in ms) and intensity (G) and its standard deviation (H) (scale bars in arbitrary units). Note that although figs. A–D are smoothed (Paravision default for image presentation), the ROI statistics are calculated on the non-smoothed data. High resolution T2*-WI of the same animal are represented in Fig. 7.

