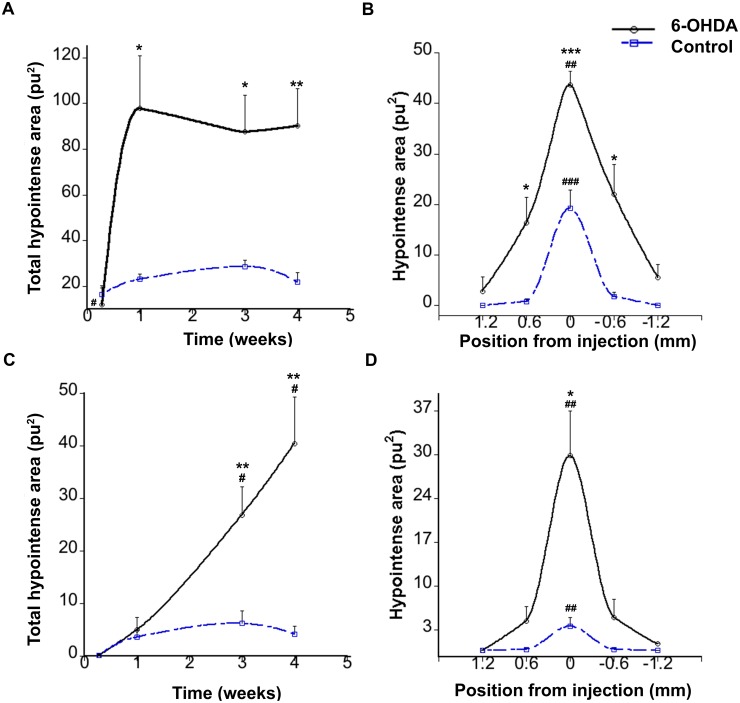
Figure 4. Hypointense evaluations from T2*- and T2 WI after striatal injections.
A) Time course evolution of total T2*-hypointensities showed no significant differences between 1, 3 and 4 weeks, but showed differences between the two groups. B) T2*-hypointense distribution at 4 weeks expressed as distance anterior (positive) and posterior (negative) to the injection site. The results show a significant difference between 6-OHDA and control animals at different distances. C) Time course evolution of total T2-hypointensities D) T2-hypointense distribution at 4 weeks at different distances to the injection site. Continuous line represents 6-OHDA injected animals and broken line represents control animals. *p<0.05, **p<0.01, ***p<0.001 compared between control and 6-OHDA animals. #p<0.05, ##p<0.01, ###p<0.001 compared between different distances or time points within each group.

