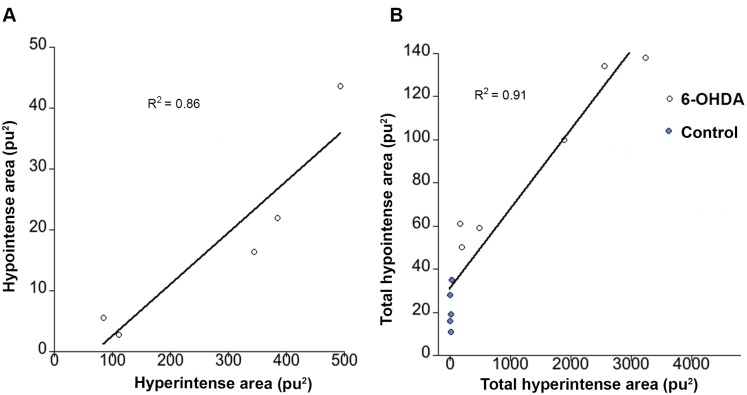
Figure 5. Correlations between edema and iron accumulation.
A) Regression line showing the correlation between hyperintensities at day 2 and corresponding hypointensities at 4 weeks for different positions in the striatum (data points = 1.2 0.6, 0, −0.6, −1.2 mm from injection) of 6-OHDA injected animals. B) Regression line showing the correlation between total hyperintense areas at day 2 and corresponding hypointense areas at 4 weeks, calculated from control, and 6-OHDA groups (represented by blue and white dots respectively).

