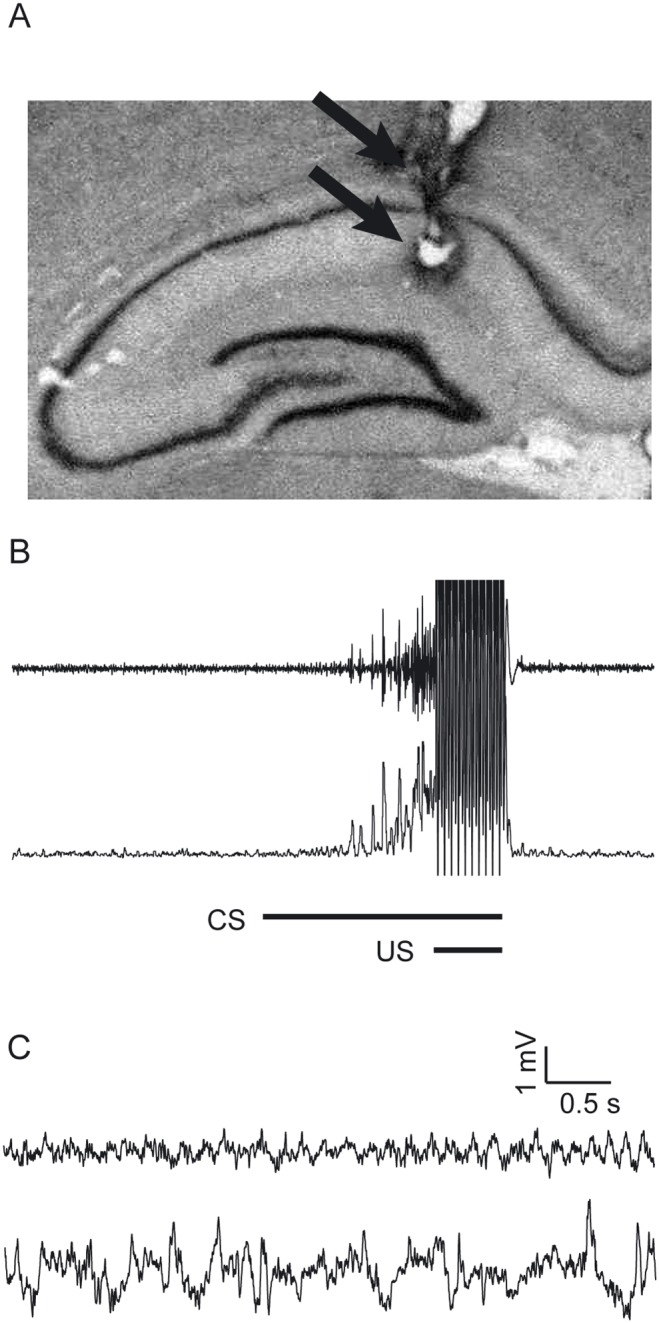
Figure 2. Electrode position in hippocampus.

(A) The picture of a brain section taken from one of the animals. The arrows show the tips of a pair of the electrodes. (B) The upper trace shows the raw EMG signal around the CS of a paired trial. The lower trace shows the EMG amplitude signal calculated using the method described in the text. (C) Representative raw hippocampal LFP signals recorded by a pair of electrodes in a same session showing theta oscillation and large irregular amplitude activity (LIA). The upper trace shows representative theta oscillation and the lower trace shows a representative LIA.
