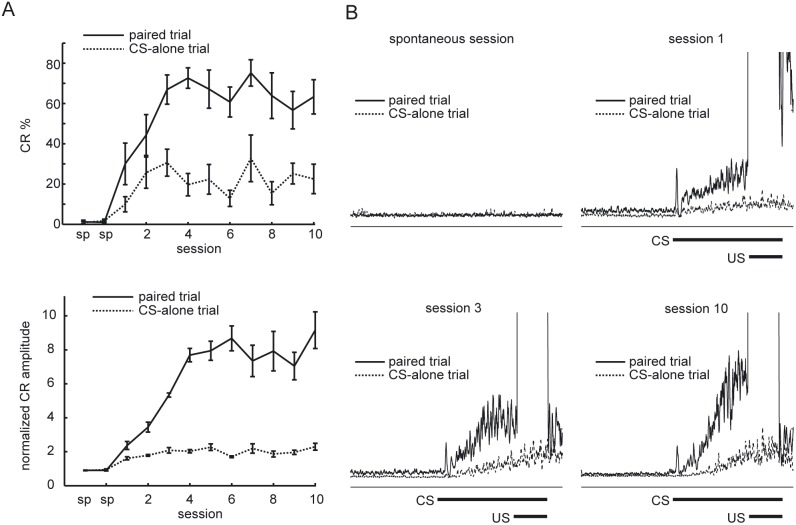
Figure 3. Acquisition of discriminative CRs.
(A) The upper figure illustrates the averaged learning curves for 5 rats calculated for each type of trials. Vertical bars indicate the standard error of the mean. The lower figure shows the learning curves illustrated by the average normalized CR amplitude across all rats calculated separately for each type of trials and session. Vertical bars indicate the standard error of the mean. (B) Averaged normalized EMG amplitudes for paired trials and CS-alone trials of a rat for different sessions. sp, spontaneous session.

